East Lansing: Fire Incidents, Michigan (MI)
Where are fire incidents reported in East Lansing, MI
Something went wrong! Please refresh the page.
| Fire incidents reported | |
|---|---|
| Sreet name | Count |
| GRAND RIVER AVE | 138 |
| ABBOT RD | 122 |
| COLEMAN RD | 96 |
| HARRISON RD | 54 |
| PARK LAKE RD | 54 |
| CHANDLER RD | 48 |
| LAKE LANSING RD | 48 |
| STODDARD AVE | 48 |
| GROVE ST | 44 |
| HAGADORN RD | 44 |
| MAC AVE | 44 |
| HANNAH BLVD | 42 |
| HASLETT RD | 42 |
| NORTHWIND DR | 42 |
| ALBERT AVE | 40 |
| SAGINAW ST | 40 |
| BURCHAM DR | 38 |
| SHAW LN | 38 |
| CIRCLE DR | 36 |
| GARDEN CITY RD | 36 |
| RIVER ST | 36 |
| BOGUE ST | 32 |
| MICHIGAN AVE | 32 |
| WILSON RD | 32 |
| MILFORD ST | 30 |
| SPARTAN AVE | 30 |
| LINDEN ST | 28 |
| ANN ST | 26 |
| COOLIDGE RD | 26 |
| SERVICE RD | 26 |
| Other | 250 |
2002 - 2018 National Fire Incident Reporting System (NFIRS) incidents
- Incident types reported to NFIRS in East Lansing, MI
- 19,35468.8%Rescue & EMS
- 4,13414.7%False Alarm
- 1,6425.8%Fire
- 1,3154.7%Hazardous Condition
- 1,0353.7%Good Intent Call
- 5572.0%Service Call
- 660.2%Special Incident
- Fire incident types reported to NFIRS in East Lansing, MI
- 70643.0%Structure Fires
- 70042.6%Outside Fires
- 1358.2%Mobile Property/Vehicle Fires
- 1016.2%Other
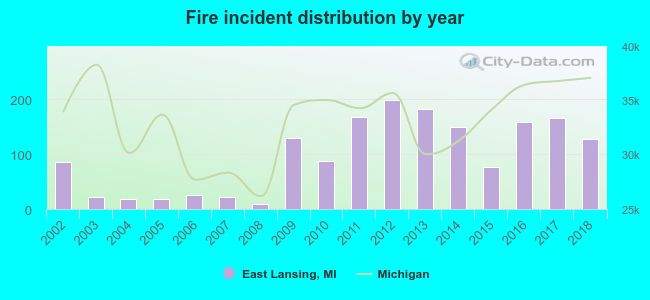 Based on the data from the years 2002 - 2018 the average number of fires per year is 97. The highest number of reported fire incidents - 198 took place in 2012, and the least - 9 in 2008. The data has an increasing trend.
The average number of yearly fire incidents per 10k residents in East Lansing, MI compared to nearest cities:
(Note: Based on data for the last 3 years, including only cities with population 5,000 and above)
| East Lansing: | 30.9 |
| Okemos: | 23.4 |
| Haslett: | 14.7 |
| Lansing: | 49.1 |
| Holt: | 21.0 |
| Mason: | 101.8 |
| Grand Ledge: | 93.3 |
| Eaton Rapids: | 87.5 |
| Charlotte: | 81.7 |
 The median response time based on all reported fire incidents is 7 minutes. This is comparable to the state median value.
The median response time in East Lansing, MI compared to nearest cities:
(Note: Based on data for all years, including only cities with at least 500 fire incidents)
| East Lansing: | 7 minutes |
| Okemos: | 7 minutes |
| Lansing: | 5 minutes |
| Holt: | 4 minutes |
| Mason: | 8 minutes |
| Grand Ledge: | 7 minutes |
| Eaton Rapids: | 10 minutes |
| Fowlerville: | 11 minutes |
| Charlotte: | 6 minutes |
 Based on the reports from the years 2002 - 2018 the average number of fire-related yearly casualties is 1. The highest number of injuries - 6 took place in 2012, and the lowest - 0 in 2003. The data has a decreasing trend.
The average number of casualties per 1,000 fire incidents is 10. This indicator was the highest - 53 in 2004, and the lowest 0 in 2003. The trend for casualties per 1,000 fire incidents is dropping. Compared to the state value the number of injuries per 1,000 fire incidents is similar.
Based on the reports from the years 2002 - 2018 the average number of fire-related yearly casualties is 1. The highest number of injuries - 6 took place in 2012, and the lowest - 0 in 2003. The data has a decreasing trend.
The average number of casualties per 1,000 fire incidents is 10. This indicator was the highest - 53 in 2004, and the lowest 0 in 2003. The trend for casualties per 1,000 fire incidents is dropping. Compared to the state value the number of injuries per 1,000 fire incidents is similar.Casualties per 1,000 incidents in East Lansing, MI compared to nearest cities:
(Note: Based on data for all years, including only cities with at least 500 fire incidents)
| East Lansing: | 11.6 |
| Okemos: | 32.5 |
| Lansing: | 20.9 |
| Holt: | 12.5 |
| Mason: | 1.3 |
| Grand Ledge: | 10.7 |
| Eaton Rapids: | 11.1 |
| Fowlerville: | 3.7 |
| Charlotte: | 20.3 |
 38.3% incidents where reported in the morning and 61.7% in the evening. The most fires (18.9%) took place on Sunday, and the least (11.0%) on Monday.
 According to the 1,642 fire incident reports from years 2002 - 2018 most fires (10.8%) took place during May, and the least (5.6%) in February.
 Out of all 28,123 cases reported during the years 2002 - 2018, the most belonged to the categories: Rescue & EMS (68.8%), False Alarm (14.7%), and Fire (5.8%).
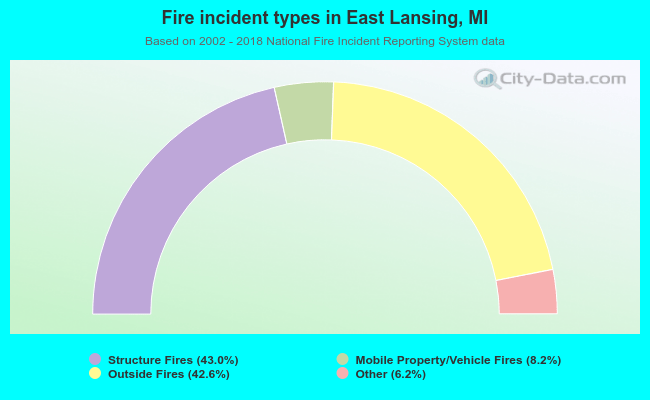 When looking into fire subcategories, the most reports belonged to: Structure Fires (43.0%), and Outside Fires (42.6%).