El Centro: Fire Incidents, California (CA)
Where are fire incidents reported in El Centro, CA
Something went wrong! Please refresh the page.
| Fire incidents reported | |
|---|---|
| Sreet name | Count |
| IMPERIAL AVE | 202 |
| MAIN ST | 190 |
| OLIVE AVE | 122 |
| STATE ST | 116 |
| 4TH ST | 110 |
| ORANGE AVE | 88 |
| ADAMS AVE | 86 |
| EVAN HEWES HWY | 84 |
| 6TH ST | 76 |
| BRIGHTON AVE | 74 |
| ROSS RD | 70 |
| COMMERCIAL AVE | 68 |
| HAMILTON AVE | 64 |
| EL CENTRO AVE | 50 |
| HOLT AVE | 50 |
| 111 HWY | 48 |
| DEALWOOD RD | 46 |
| ROSS AVE | 44 |
| EUCLID AVE | 42 |
| HEIL AVE | 42 |
| 8TH ST | 38 |
| 2ND ST | 36 |
| 5TH ST | 36 |
| MCCABE RD | 34 |
| WAKE AVE | 34 |
| 3RD ST | 32 |
| DOGWOOD AVE | 30 |
| MAIN | 30 |
| 7TH ST | 28 |
| BOWKER RD | 26 |
| Other | 85 |
2005 - 2018 National Fire Incident Reporting System (NFIRS) incidents
- Incident types reported to NFIRS in El Centro, CA
- 12,31066.3%Rescue & EMS
- 2,08111.2%Fire
- 1,4557.8%Good Intent Call
- 1,3507.3%False Alarm
- 8614.6%Service Call
- 4862.6%Hazardous Condition
- Fire incident types reported to NFIRS in El Centro, CA
- 1,21858.5%Outside Fires
- 53425.7%Structure Fires
- 27113.0%Mobile Property/Vehicle Fires
- 582.8%Other
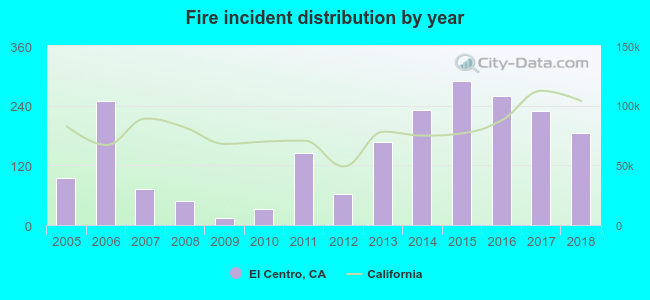 According to the data from the years 2005 - 2018 the average number of fires per year is 149. The highest number of reported fires - 289 took place in 2015, and the least - 15 in 2009. The data has an increasing trend.
The average number of yearly fire incidents per 10k residents in El Centro, CA compared to nearest cities:
(Note: Based on data for the last 3 years, including only cities with population 5,000 and above)
| El Centro: | 51.5 |
| Imperial: | 22.6 |
| Calexico: | 27.1 |
| Holtville: | 75.3 |
| Brawley: | 21.6 |
| Calipatria: | 4.4 |
| Oasis: | 1.5 |
| Mecca: | 3.5 |
| Alpine: | 48.0 |
 The median response time based on all reported fire incidents is 5 minutes. This is lower compared to the state median value.
The median response time in El Centro, CA compared to nearest cities:
(Note: Based on data for all years, including only cities with at least 500 fire incidents)
| El Centro: | 5 minutes |
| Imperial: | 6 minutes |
| Calexico: | 5 minutes |
| Holtville: | 11 minutes |
| Yuma: | 6 minutes |
| Alpine: | 9 minutes |
| Ramona: | 5 minutes |
| Lakeside: | 8 minutes |
| El Cajon: | 6 minutes |
 According to the data from the years 2005 - 2018 the average number of fire-related fatalities per year is 1. The highest number of reported deaths - 2 took place in 2012, and the lowest - 0 in 2005. The data has a constant trend.
 According to the reports from the years 2005 - 2018 the average number of fire-related yearly casualties is 1. The highest number of reported injuries - 7 took place in 2015, and the lowest - 0 in 2005. The data has a rising trend.
The average number of casualties per 1,000 fires is 6. This indicator was the highest - 24 in 2015, and the lowest 0 in 2005. The trend for casualties per 1,000 fires is growing. Compared to the California value the number of casualties per 1,000 fire incidents is higher.
According to the reports from the years 2005 - 2018 the average number of fire-related yearly casualties is 1. The highest number of reported injuries - 7 took place in 2015, and the lowest - 0 in 2005. The data has a rising trend.
The average number of casualties per 1,000 fires is 6. This indicator was the highest - 24 in 2015, and the lowest 0 in 2005. The trend for casualties per 1,000 fires is growing. Compared to the California value the number of casualties per 1,000 fire incidents is higher.
 35.2% incidents where reported in the morning and 64.8% in the evening. The most fires (15.6%) took place on Thursday, and the least (13.0%) on Wednesday.
 Based on the 2,081 fire incidents from years 2005 - 2018 most fires (9.9%) took place during March, and the least (6.2%) in September.
 Out of all 18,568 cases reported during the years 2005 - 2018, the most belonged to the categories: Rescue & EMS (66.3%), Fire (11.2%), and Good Intent Call (7.8%).
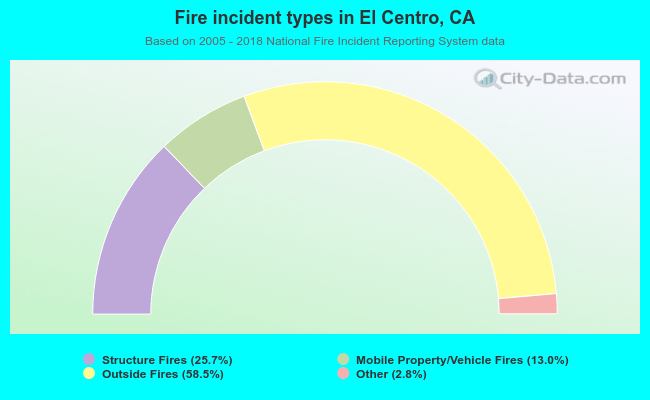 When looking into fire subcategories, the most reports belonged to: Outside Fires (58.5%), and Structure Fires (25.7%).