El Reno: Fire Incidents, Oklahoma (OK)
Where are fire incidents reported in El Reno, OK
Something went wrong! Please refresh the page.
| Fire incidents reported | |
|---|---|
| Sreet name | Count |
| I-40 | 212 |
| HWY 66 | 190 |
| HWY 81 | 176 |
| BRITTON RD | 136 |
| COUNTRY CLUB RD | 134 |
| I40 | 130 |
| CHOCTAW AVE | 116 |
| ELM ST | 114 |
| FOREMAN ST | 112 |
| ROCK ISLAND AVE | 104 |
| WATTS ST | 86 |
| SHEPARD AVE | 84 |
| EVANS AVE | 80 |
| SUNSET DR | 76 |
| JENSEN RD | 74 |
| MILES AVE | 68 |
| FOSTER AVE | 64 |
| WADE ST | 60 |
| RENO AVE | 56 |
| MANNING RD | 54 |
| REFORMATORY RD | 54 |
| 27TH ST | 52 |
| BICKFORD AVE | 50 |
| HOFF AVE | 50 |
| RADIO RD | 50 |
| WOODSON ST | 50 |
| ALFADALE | 46 |
| ROGERS ST | 46 |
| ELLISON AVE | 44 |
| GRAND AVE | 44 |
2002 - 2018 National Fire Incident Reporting System (NFIRS) incidents
- Incident types reported to NFIRS in El Reno, OK
- 2,45936.5%Fire
- 1,41721.0%Hazardous Condition
- 1,26318.8%Rescue & EMS
- 6479.6%Good Intent Call
- 4626.9%Service Call
- 3765.6%False Alarm
- 881.3%Severe Weather
- 200.3%Overpressure Rupture
- Fire incident types reported to NFIRS in El Reno, OK
- 1,51261.5%Outside Fires
- 55222.4%Structure Fires
- 33613.7%Mobile Property/Vehicle Fires
- 592.4%Other
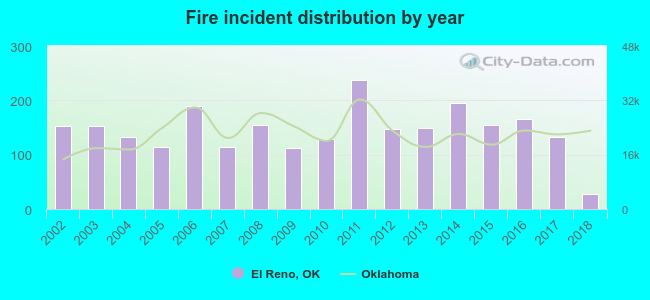 According to the data from the years 2002 - 2018 the average number of fire incidents per year is 145. The highest number of reported fire incidents - 238 took place in 2011, and the least - 27 in 2018. The data has a declining trend.
The average number of yearly fire incidents per 10k residents in El Reno, OK compared to nearest cities:
(Note: Based on data for the last 3 years, including only cities with population 5,000 and above)
| El Reno: | 59.7 |
| Yukon: | 78.8 |
| Piedmont: | 58.9 |
| Mustang: | 48.0 |
| Bethany: | 32.2 |
| Tuttle: | 127.4 |
| Warr Acres: | 38.4 |
| The Village: | 24.7 |
| Oklahoma City: | 37.3 |
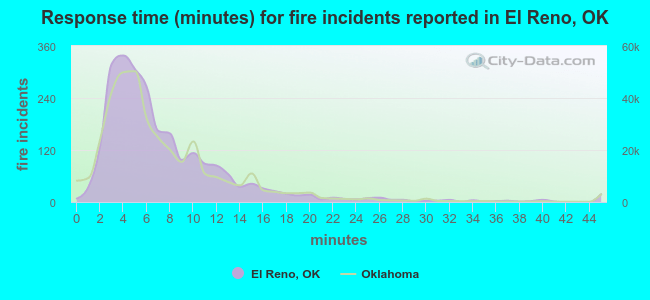 The median response time based on all reported fire incidents is 6 minutes. This is comparable to the Oklahoma median value.
The median response time in El Reno, OK compared to nearest cities:
(Note: Based on data for all years, including only cities with at least 500 fire incidents)
| El Reno: | 6 minutes |
| Calumet: | 10 minutes |
| Yukon: | 6 minutes |
| Okarche: | 12 minutes |
| Mustang: | 4 minutes |
| Bethany: | 4 minutes |
| Tuttle: | 7 minutes |
| Warr Acres: | 3 minutes |
| Geary: | 10 minutes |
 Based on the data from the years 2002 - 2018 the average number of fire-related casualties per year is 1. The highest number of reported casualties - 6 took place in 2004, and the lowest - 0 in 2010. The data has a decreasing trend.
The average number of injuries per 1,000 fire incidents is 9. This indicator was the highest - 45 in 2004, and the lowest 0 in 2010. The trend for injuries per 1,000 incidents is declining. Compared to the Oklahoma value the number of injuries per 1,000 incidents is much higher.
Based on the data from the years 2002 - 2018 the average number of fire-related casualties per year is 1. The highest number of reported casualties - 6 took place in 2004, and the lowest - 0 in 2010. The data has a decreasing trend.
The average number of injuries per 1,000 fire incidents is 9. This indicator was the highest - 45 in 2004, and the lowest 0 in 2010. The trend for injuries per 1,000 incidents is declining. Compared to the Oklahoma value the number of injuries per 1,000 incidents is much higher.
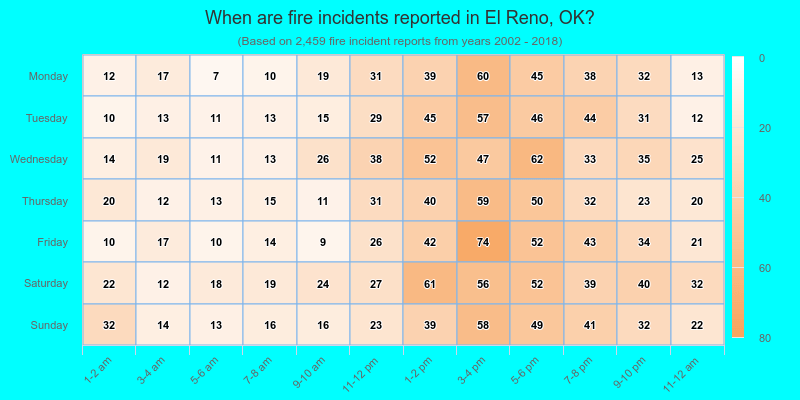
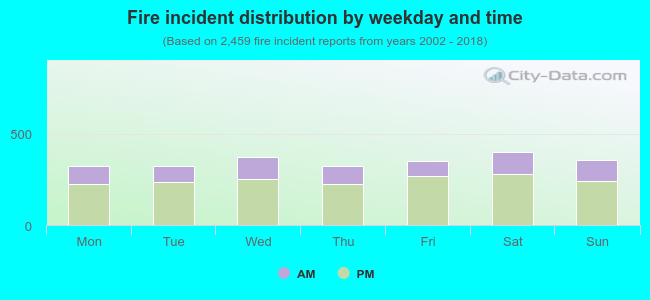 29.8% incidents where reported in the morning and 70.2% in the evening. The most fires (16.3%) took place on Saturday, and the least (13.1%) on Monday.
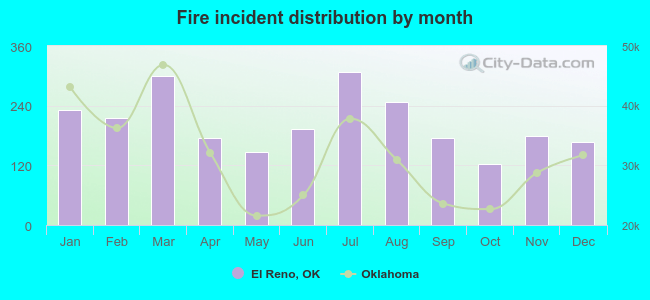 According to the 2,459 fire incident reports from years 2002 - 2018 most fires (12.5%) took place during July, and the least (5.0%) in October.
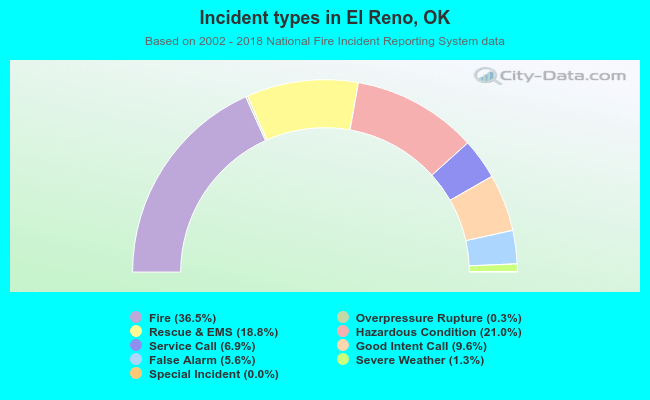 Out of all 6,735 cases reported during the years 2002 - 2018, the most belonged to the categories: Fire (36.5%), Hazardous Condition (21.0%), and Rescue & EMS (18.8%).
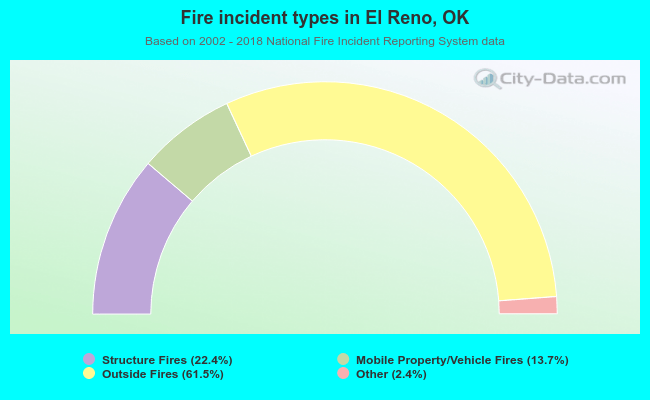 When looking into fire subcategories, the most incidents belonged to: Outside Fires (61.5%), and Structure Fires (22.4%).