Elizabeth: Fire Incidents, New Jersey (NJ)
Where are fire incidents reported in Elizabeth, NJ
Something went wrong! Please refresh the page.
| Fire incidents reported | |
|---|---|
| Sreet name | Count |
| NORTH BROAD STREET | 750 |
| EAST JERSEY STREET | 688 |
| SEVENTH STREET | 616 |
| MRAVLAG MANOR | 486 |
| MADISON AVENUE | 448 |
| CHERRY STREET | 444 |
| ELIZABETH AVENUE | 410 |
| DIVISION STREET | 384 |
| NORTH AVENUE | 340 |
| NEWARK AVENUE | 320 |
| PARKER ROAD | 310 |
| WEST GRAND STREET | 292 |
| MAGNOLIA AVENUE | 260 |
| IRVINGTON AVENUE | 252 |
| BROAD STREET | 250 |
| WESTFIELD AVENUE | 248 |
| JEFFERSON AVENUE | 246 |
| ELMORA AVENUE | 236 |
| PEARL STREET | 236 |
| SECOND STREET | 204 |
| MORRIS AVENUE | 200 |
| KAPKOWSKI ROAD | 196 |
| FIRST STREET | 190 |
| BOND STREET | 180 |
| FULTON STREET | 180 |
| SOUTH BROAD STREET | 178 |
| WEST JERSEY STREET | 172 |
| SALEM AVENUE | 166 |
| MARSHALL STREET | 162 |
| GLIMCHER REALTY WAY | 160 |
| Other | 378 |
2003 - 2018 National Fire Incident Reporting System (NFIRS) incidents
- Incident types reported to NFIRS in Elizabeth, NJ
- 65,76460.5%Rescue & EMS
- 11,38410.5%Hazardous Condition
- 9,5828.8%Fire
- 9,1558.4%False Alarm
- 7,9267.3%Service Call
- 4,3324.0%Good Intent Call
- 4000.4%Overpressure Rupture
- 1180.1%Special Incident
- Fire incident types reported to NFIRS in Elizabeth, NJ
- 5,80960.6%Structure Fires
- 2,23923.4%Outside Fires
- 1,29913.6%Mobile Property/Vehicle Fires
- 2352.5%Other
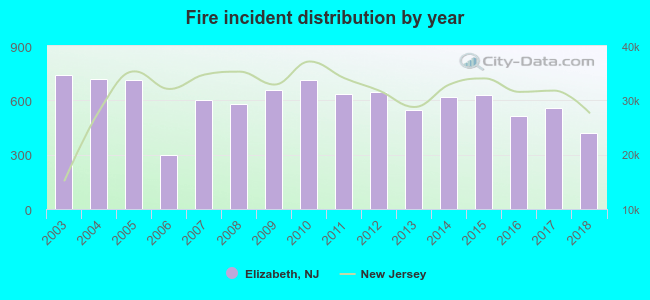 According to the data from the years 2003 - 2018 the average number of fire incidents per year is 599. The highest number of reported fire incidents - 738 took place in 2003, and the least - 296 in 2006. The data has a declining trend.
The average number of yearly fire incidents per 10k residents in Elizabeth, NJ compared to nearest cities:
(Note: Based on data for the last 3 years, including only cities with population 5,000 and above)
| Elizabeth: | 38.7 |
| Hillside: | 34.1 |
| Roselle: | 24.1 |
| Linden: | 28.5 |
| Roselle Park: | 13.5 |
| Union: | 27.8 |
| Kenilworth: | 14.3 |
| Irvington: | 26.2 |
| Bayonne: | 12.1 |
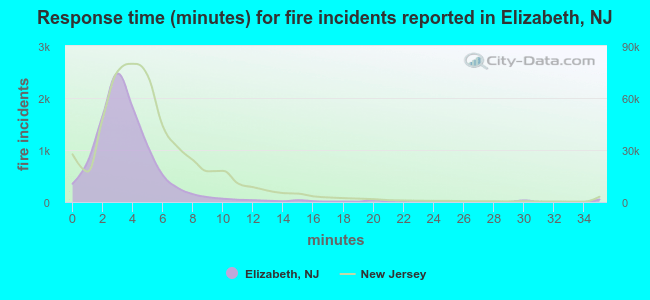 The median response time based on all reported fire incidents is 3 minutes. This is lower compared to the New Jersey median value.
The median response time in Elizabeth, NJ compared to nearest cities:
(Note: Based on data for all years, including only cities with at least 500 fire incidents)
| Elizabeth: | 3 minutes |
| Hillside: | 3 minutes |
| Roselle: | 3 minutes |
| Linden: | 4 minutes |
| Union: | 5 minutes |
| Irvington: | 3 minutes |
| Bayonne: | 4 minutes |
| Cranford: | 4 minutes |
| Newark: | 3 minutes |
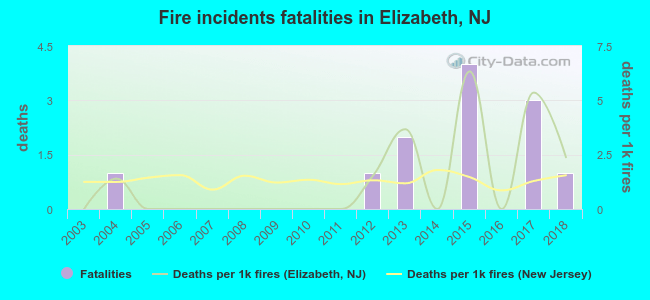 According to the data from the years 2003 - 2018 the average number of fire-related fatalities per year is 1. The highest number of reported deaths - 4 took place in 2015, and the lowest - 0 in 2003. The data has a growing trend.
The average number of deaths per 1,000 fire incidents is 1. This indicator was the highest - 6 in 2015, and the lowest 0 in 2003. The trend for fatalities per 1,000 incidents is rising. Compared to the New Jersey value the number of deaths per 1,000 fires is about the same.
According to the data from the years 2003 - 2018 the average number of fire-related fatalities per year is 1. The highest number of reported deaths - 4 took place in 2015, and the lowest - 0 in 2003. The data has a growing trend.
The average number of deaths per 1,000 fire incidents is 1. This indicator was the highest - 6 in 2015, and the lowest 0 in 2003. The trend for fatalities per 1,000 incidents is rising. Compared to the New Jersey value the number of deaths per 1,000 fires is about the same.Deaths per 1,000 incidents in Elizabeth, NJ compared to nearest cities:
(Note: Based on data for all years, including only cities with at least 2,500 fire incidents)
| Elizabeth: | 1.3 |
| Union: | 2.7 |
| Irvington: | 2.9 |
| Newark: | 1.3 |
| East Orange: | 3.9 |
| Jersey City: | 0.9 |
| Perth Amboy: | 2.4 |
| Hoboken: | 0.7 |
| Union City: | 2.6 |
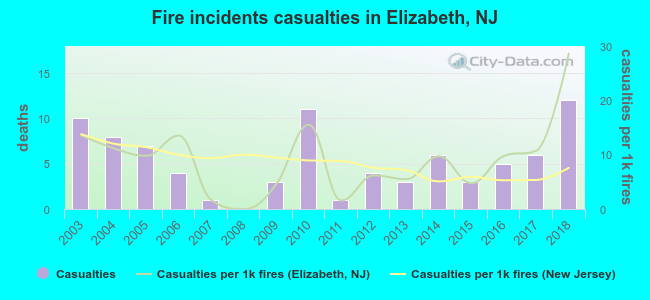 Based on the reports from the years 2003 - 2018 the average number of fire-related yearly casualties is 5. The highest number of reported casualties - 12 took place in 2018, and the lowest - 0 in 2008. The data has an increasing trend.
The average number of injuries per 1,000 fires is 9. This indicator was the highest - 29 in 2018, and the lowest 0 in 2008. The trend for casualties per 1,000 fire incidents is increasing. Compared to the New Jersey value the number of casualties per 1,000 fires is similar.
Based on the reports from the years 2003 - 2018 the average number of fire-related yearly casualties is 5. The highest number of reported casualties - 12 took place in 2018, and the lowest - 0 in 2008. The data has an increasing trend.
The average number of injuries per 1,000 fires is 9. This indicator was the highest - 29 in 2018, and the lowest 0 in 2008. The trend for casualties per 1,000 fire incidents is increasing. Compared to the New Jersey value the number of casualties per 1,000 fires is similar.
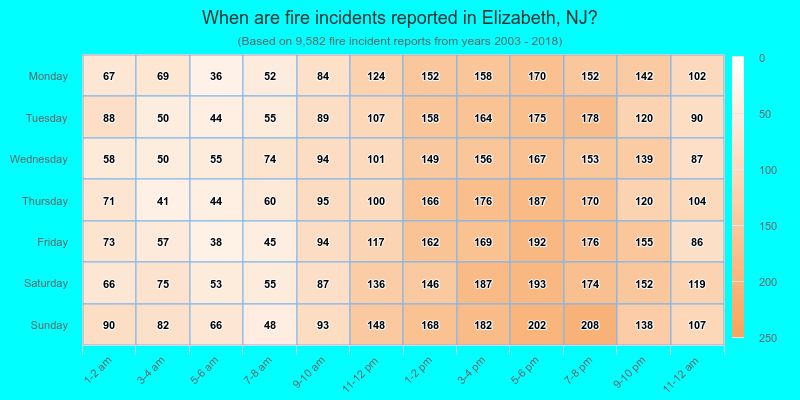
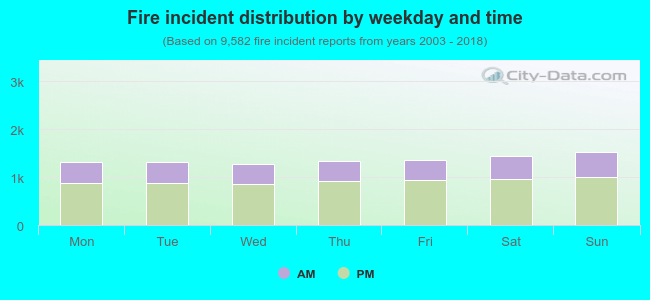 32.7% incidents where reported in the morning and 67.3% in the evening. The most fires (16.0%) took place on Sunday, and the least (13.4%) on Wednesday.
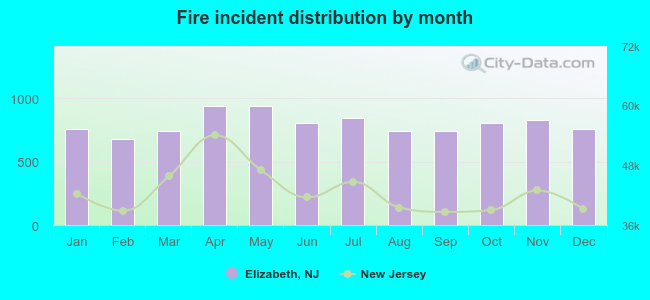 According to the 9,582 fire incidents from years 2003 - 2018 most fires (9.8%) took place during May, and the least (7.1%) in February.
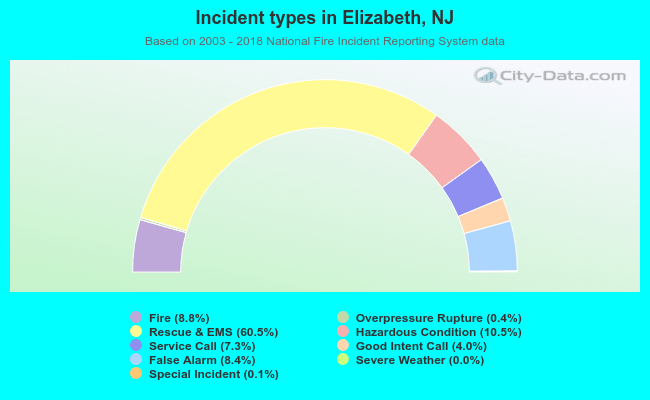 Out of all 108,697 cases reported during the years 2003 - 2018, the most belonged to the categories: Rescue & EMS (60.5%), Hazardous Condition (10.5%), and Fire (8.8%).
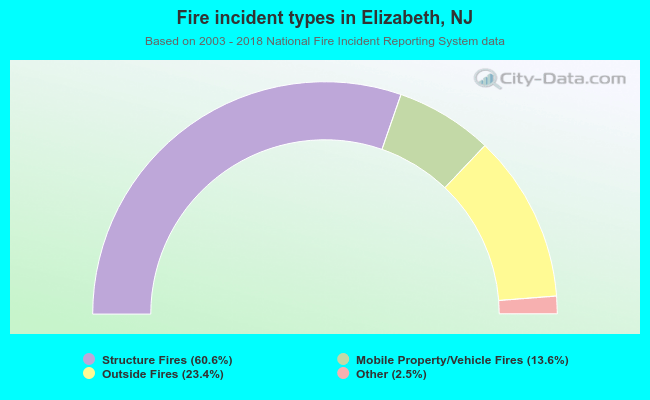 When looking into fire subcategories, the most incidents belonged to: Structure Fires (60.6%), and Outside Fires (23.4%).