Erlanger: Fire Incidents, Kentucky (KY)
Where are fire incidents reported in Erlanger, KY
Something went wrong! Please refresh the page.
| Fire incidents reported | |
|---|---|
| Sreet name | Count |
| DIXIE HWY | 138 |
| COMMONWEALTH AVE | 64 |
| ERLANGER RD | 52 |
| I75 | 52 |
| DONALDSON HWY | 48 |
| I-275 | 48 |
| I-75 | 46 |
| RIGGS AVE | 46 |
| I275 | 42 |
| QUEENSWAY DR | 42 |
| TURFWAY RD | 42 |
| LORI DR | 36 |
| GREENFIELD LA | 34 |
| OLYMPIC BLVD | 32 |
| DONALDSON | 30 |
| RIDGEWOOD | 26 |
| EAGLE CREEK DR | 22 |
| GREENFIELD LN | 22 |
| NARROWS RD | 22 |
| CINTONYA | 20 |
| HULBERT | 20 |
| JAMIKE AVE | 20 |
| STEVENSON | 20 |
| AIRPORT EXCHANGE BLVD | 18 |
| CRESCENT SPRINGS RD | 18 |
| FOREST AVE | 18 |
| CRESCENT AVE | 16 |
| DIXIE HWY | 16 |
| GRAVES AVE | 16 |
| KENTON LANDS RD | 16 |
| Other | 165 |
2002 - 2018 National Fire Incident Reporting System (NFIRS) incidents
- Incident types reported to NFIRS in Erlanger, KY
- 4,59844.4%Rescue & EMS
- 1,46614.2%Hazardous Condition
- 1,27812.4%Good Intent Call
- 1,20711.7%Fire
- 9228.9%False Alarm
- 8127.8%Service Call
- 280.3%Overpressure Rupture
- 280.3%Severe Weather
- Fire incident types reported to NFIRS in Erlanger, KY
- 45837.9%Structure Fires
- 39332.6%Outside Fires
- 28623.7%Mobile Property/Vehicle Fires
- 705.8%Other
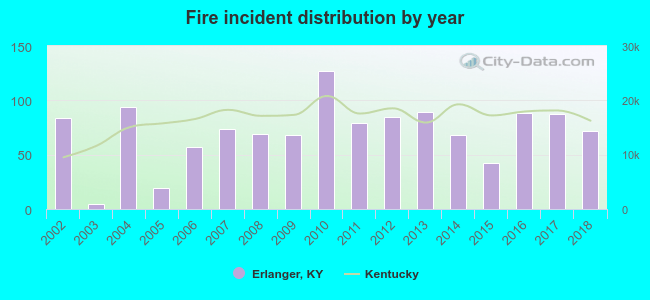 According to the data from the years 2002 - 2018 the average number of fire incidents per year is 71. The highest number of reported fires - 127 took place in 2010, and the least - 5 in 2003. The data has a dropping trend.
The average number of yearly fire incidents per 10k residents in Erlanger, KY compared to nearest cities:
(Note: Based on data for the last 3 years, including only cities with population 5,000 and above)
| Erlanger: | 44.2 |
| Elsmere: | 33.3 |
| Edgewood: | 17.9 |
| Florence: | 68.6 |
| Fort Mitchell: | 26.6 |
| Villa Hills: | 16.2 |
| Fort Wright: | 20.3 |
| Independence: | 26.2 |
| Taylor Mill: | 24.8 |
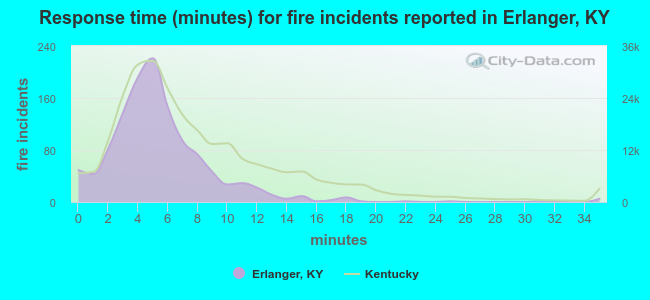 The median response time based on all reported fire incidents is 5 minutes. This is lower compared to the state median value.
The median response time in Erlanger, KY compared to nearest cities:
(Note: Based on data for all years, including only cities with at least 500 fire incidents)
| Erlanger: | 5 minutes |
| Florence: | 6 minutes |
| Fort Wright: | 6 minutes |
| Independence: | 5 minutes |
| Covington: | 4 minutes |
| Burlington: | 7 minutes |
| Newport: | 4 minutes |
| Hebron: | 6 minutes |
| Alexandria: | 7 minutes |
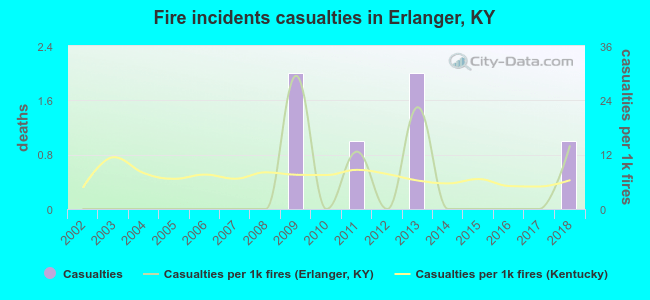 According to the reports from the years 2002 - 2018 the average number of fire-related casualties per year is 0. The highest number of reported casualties - 2 took place in 2009, and the lowest - 0 in 2002. The data has an increasing trend.
The average number of casualties per 1,000 fire incidents is 5. This indicator was the highest - 29 in 2009, and the lowest 0 in 2002. The trend for casualties per 1,000 incidents is growing. Compared to the Kentucky value the number of casualties per 1,000 fires is lower.
According to the reports from the years 2002 - 2018 the average number of fire-related casualties per year is 0. The highest number of reported casualties - 2 took place in 2009, and the lowest - 0 in 2002. The data has an increasing trend.
The average number of casualties per 1,000 fire incidents is 5. This indicator was the highest - 29 in 2009, and the lowest 0 in 2002. The trend for casualties per 1,000 incidents is growing. Compared to the Kentucky value the number of casualties per 1,000 fires is lower.Casualties per 1,000 incidents in Erlanger, KY compared to nearest cities:
(Note: Based on data for all years, including only cities with at least 500 fire incidents)
| Erlanger: | 5.0 |
| Florence: | 14.5 |
| Fort Wright: | 3.9 |
| Independence: | 8.4 |
| Covington: | 14.0 |
| Burlington: | 14.4 |
| Newport: | 20.2 |
| Hebron: | 3.9 |
| Alexandria: | 14.1 |
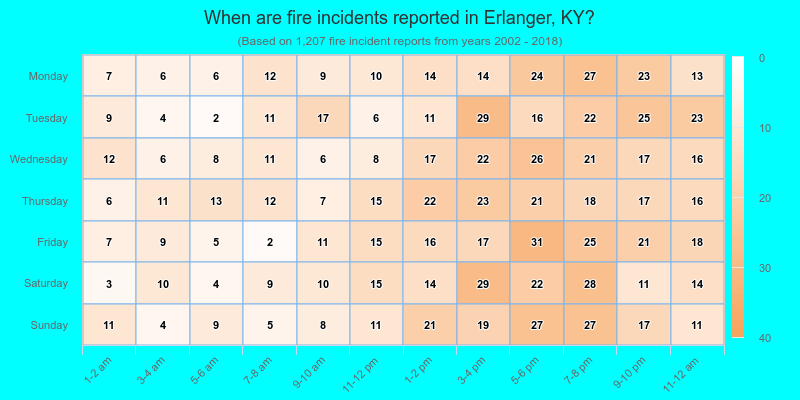
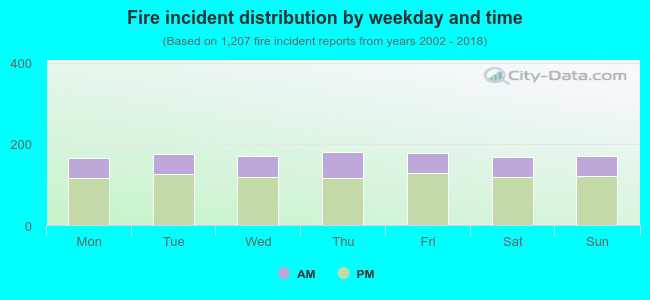 30.0% incidents where reported in the morning and 70.0% in the evening. The most fires (15.0%) took place on Thursday, and the least (13.7%) on Monday.
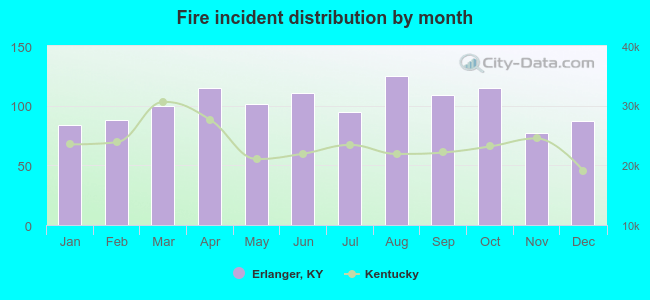 According to the 1,207 fire incidents from years 2002 - 2018 most fires (10.4%) took place during August, and the least (6.4%) in November.
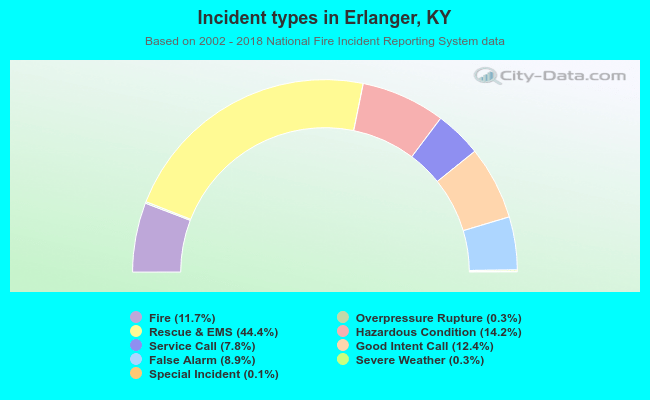 Out of all 10,345 cases reported during the years 2002 - 2018, the most belonged to the categories: Rescue & EMS (44.4%), Hazardous Condition (14.2%), and Good Intent Call (12.4%).
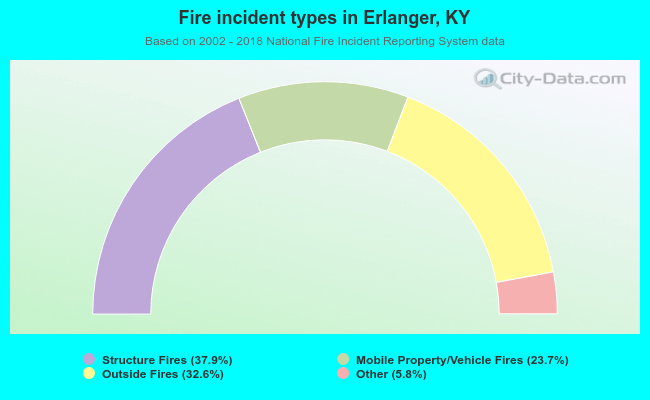 When looking into fire subcategories, the most incidents belonged to: Structure Fires (37.9%), and Outside Fires (32.6%).