Eureka Springs: Fire Incidents, Arkansas (AR)
Where are fire incidents reported in Eureka Springs, AR
Something went wrong! Please refresh the page.
|
| |||||||||||||||||||||||||||||||||||||||||||||||||||||||||||||||||||||||||||||||||||||||||||||||||||||||||||||
| Other | 436 | |||||||||||||||||||||||||||||||||||||||||||||||||||||||||||||||||||||||||||||||||||||||||||||||||||||||||||||
2002 - 2018 National Fire Incident Reporting System (NFIRS) incidents
- Incident types reported to NFIRS in Eureka Springs, AR
- 98234.6%Fire
- 87630.9%Rescue & EMS
- 42214.9%Hazardous Condition
- 2027.1%False Alarm
- 1956.9%Good Intent Call
- 1475.2%Service Call
- 70.2%Severe Weather
- 50.2%Special Incident
- 30.1%Overpressure Rupture
- Fire incident types reported to NFIRS in Eureka Springs, AR
- 55056.0%Outside Fires
- 28829.3%Structure Fires
- 939.5%Mobile Property/Vehicle Fires
- 515.2%Other
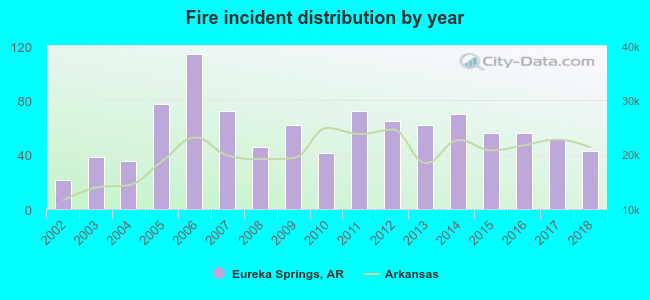 Based on the data from the years 2002 - 2018 the average number of fire incidents per year is 58. The highest number of reported fire incidents - 114 took place in 2006, and the least - 21 in 2002. The data has a rising trend.
 The median response time based on all reported fire incidents is 8 minutes. This is higher than the state median value.
The median response time in Eureka Springs, AR compared to nearest cities:
(Note: Based on data for all years, including only cities with at least 500 fire incidents)
| Eureka Springs: | 8 minutes |
| Berryville: | 9 minutes |
| Garfield: | 12 minutes |
| Green Forest: | 11 minutes |
| Pea Ridge: | 9 minutes |
| Huntsville: | 11 minutes |
| Rogers: | 6 minutes |
| Lowell: | 5 minutes |
| Bentonville: | 5 minutes |
 29.9% incidents where reported in the morning and 70.1% in the evening. The most fires (15.6%) took place on Friday, and the least (12.9%) on Monday.
 According to the 982 fire incident reports from years 2002 - 2018 most fires (16.0%) took place during March, and the least (4.1%) in June.
 Out of all 2,839 cases reported during the years 2002 - 2018, the most belonged to the categories: Fire (34.6%), Rescue & EMS (30.9%), and Hazardous Condition (14.9%).
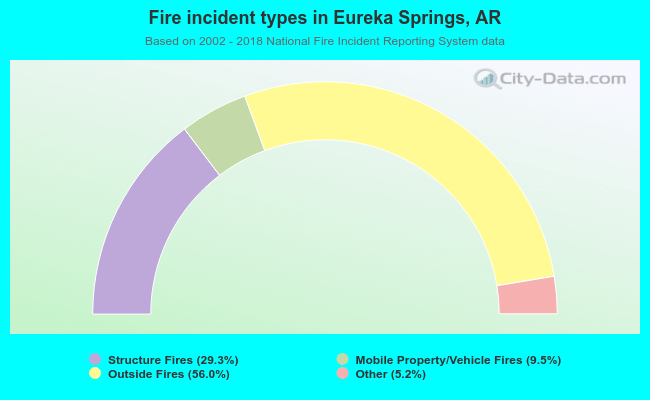 When looking into fire subcategories, the most incidents belonged to: Outside Fires (56.0%), and Structure Fires (29.3%).