Falcon Heights: Fire Incidents, Minnesota (MN)
Where are fire incidents reported in Falcon Heights, MN
Something went wrong! Please refresh the page.
|
| |||||||||||||||||||||||||||||||||||||||||||||||||||||||||||||||||||||||||||||||||||||||||||||||||||||||||||||
2002 - 2018 National Fire Incident Reporting System (NFIRS) incidents
- Incident types reported to NFIRS in Falcon Heights, MN
- 48832.6%Rescue & EMS
- 26517.7%Fire
- 25417.0%False Alarm
- 25216.8%Hazardous Condition
- 1208.0%Good Intent Call
- 1097.3%Service Call
- 90.6%Overpressure Rupture
- Fire incident types reported to NFIRS in Falcon Heights, MN
- 17666.4%Structure Fires
- 5219.6%Outside Fires
- 269.8%Mobile Property/Vehicle Fires
- 114.2%Other
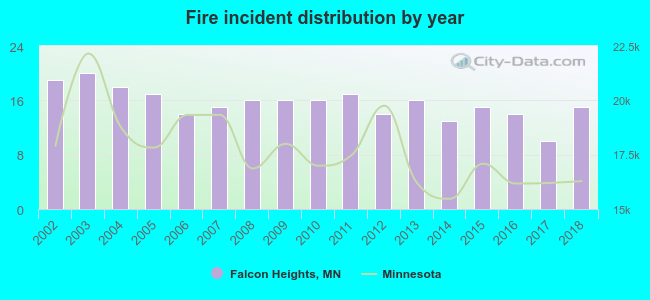 According to the data from the years 2002 - 2018 the average number of fires per year is 16. The highest number of fire incidents - 20 took place in 2003, and the least - 10 in 2017. The data has a dropping trend.
The average number of yearly fire incidents per 10k residents in Falcon Heights, MN compared to nearest cities:
(Note: Based on data for the last 3 years, including only cities with population 5,000 and above)
| Falcon Heights: | 23.6 |
| Roseville: | 26.0 |
| Arden Hills: | 20.6 |
| Minneapolis: | 24.5 |
| Little Canada: | 43.0 |
| New Brighton: | 30.8 |
| Columbia Heights: | 33.0 |
| Vadnais Heights: | 27.4 |
| Shoreview: | 11.8 |

 33.2% incidents where reported in the morning and 66.8% in the evening. The most fires (18.5%) took place on Saturday, and the least (11.3%) on Tuesday.
 Based on the 265 incident reports from years 2002 - 2018 most fires (11.7%) took place during January, and the least (6.0%) in September.
 Out of all 1,498 cases reported during the years 2002 - 2018, the most belonged to the categories: Rescue & EMS (32.6%), Fire (17.7%), and False Alarm (17.0%).
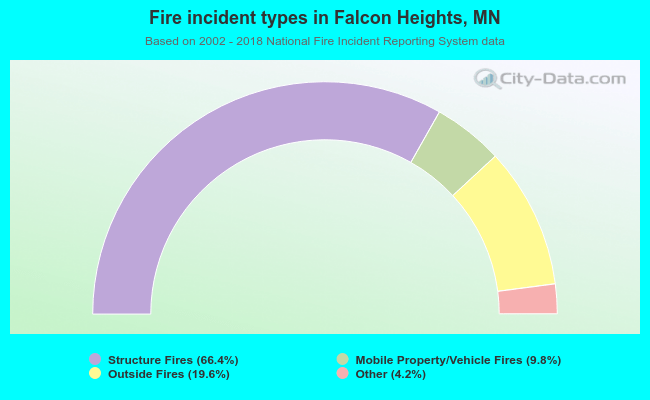 When looking into fire subcategories, the most reports belonged to: Structure Fires (66.4%), and Outside Fires (19.6%).