Farmington: Fire Incidents, New York (NY)
Where are fire incidents reported in Farmington, NY
Something went wrong! Please refresh the page.
|
| |||||||||||||||||||||||||||||||||||||||||||||||||||||||||||||||||||||||||||||||||||||||||||||||||||||||||||||
| Other | 63 | |||||||||||||||||||||||||||||||||||||||||||||||||||||||||||||||||||||||||||||||||||||||||||||||||||||||||||||
2002 - 2018 National Fire Incident Reporting System (NFIRS) incidents
- Incident types reported to NFIRS in Farmington, NY
- 1,05033.1%Hazardous Condition
- 53917.0%Fire
- 49815.7%Rescue & EMS
- 46014.5%False Alarm
- 39112.3%Service Call
- 1765.5%Good Intent Call
- 331.0%Severe Weather
- 220.7%Overpressure Rupture
- Fire incident types reported to NFIRS in Farmington, NY
- 22441.6%Structure Fires
- 16630.8%Outside Fires
- 10419.3%Mobile Property/Vehicle Fires
- 458.3%Other
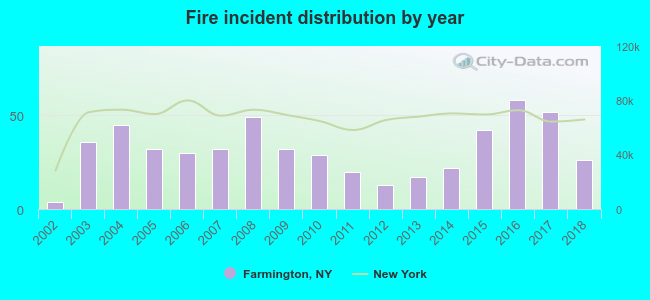 Based on the data from the years 2002 - 2018 the average number of fires per year is 32. The highest number of fires - 58 took place in 2016, and the least - 4 in 2002. The data has a rising trend.
The average number of yearly fire incidents per 10k residents in Farmington, NY compared to nearest cities:
(Note: Based on data for the last 3 years, including only cities with population 5,000 and above)
| Farmington: | 38.3 |
| Canandaigua: | 116.0 |
| Perinton: | 2.3 |
| Fairport: | 126.0 |
| Mendon: | 12.7 |
| Newark: | 26.2 |
| Walworth: | 17.6 |
| East Rochester: | 31.3 |
| Arcadia: | 2.1 |
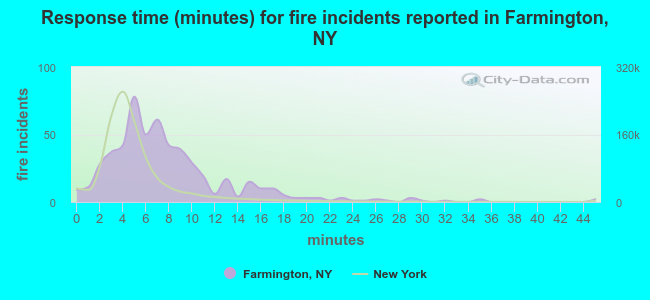 The median response time based on all reported fire incidents is 7 minutes. This is higher compared to the New York median value.
The median response time in Farmington, NY compared to nearest cities:
(Note: Based on data for all years, including only cities with at least 500 fire incidents)
| Farmington: | 7 minutes |
| Victor: | 6 minutes |
| Canandaigua: | 4 minutes |
| Fairport: | 6 minutes |
| Pittsford: | 6 minutes |
| Newark: | 5 minutes |
| Penfield: | 7 minutes |
| Webster: | 6 minutes |
| Geneva: | 2 minutes |
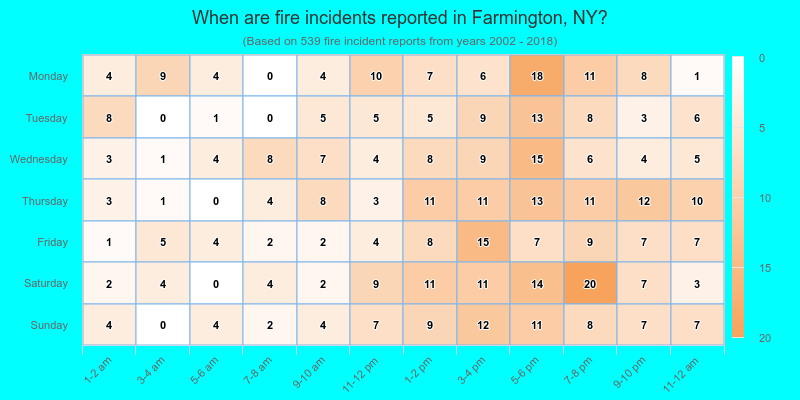
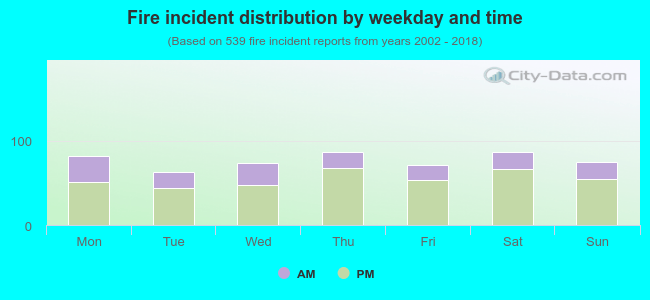 28.9% incidents where reported in the morning and 71.1% in the evening. The most fires (16.1%) took place on Thursday, and the least (11.7%) on Tuesday.
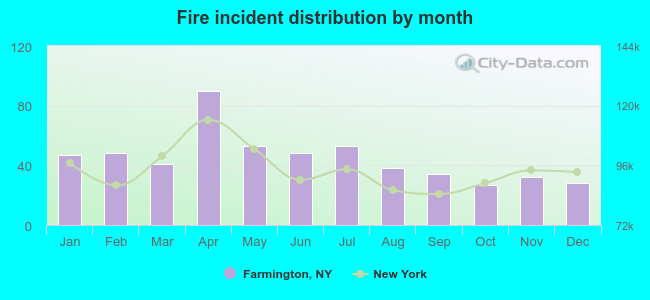 According to the 539 fire incident reports from years 2002 - 2018 most fires (16.7%) took place during April, and the least (5.0%) in October.
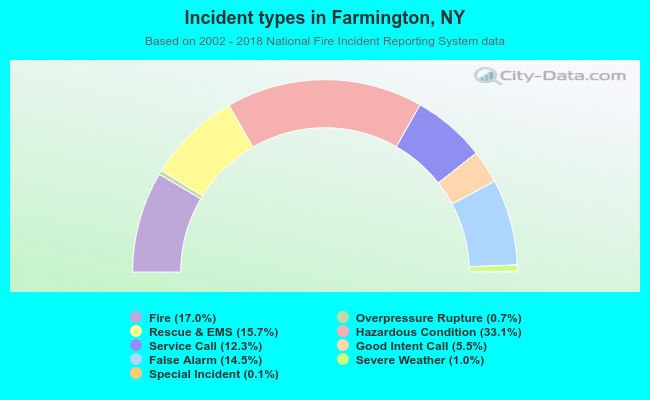 Out of all 3,172 cases reported during the years 2002 - 2018, the most belonged to the categories: Hazardous Condition (33.1%), Fire (17.0%), and Rescue & EMS (15.7%).
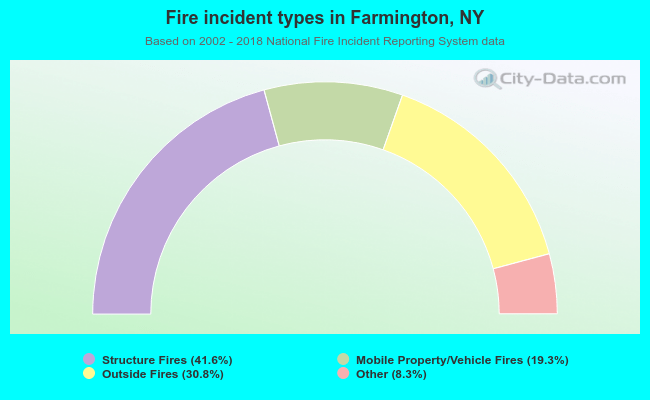 When looking into fire subcategories, the most reports belonged to: Structure Fires (41.6%), and Outside Fires (30.8%).