Fayetteville: Fire Incidents, North Carolina (NC)
Where are fire incidents reported in Fayetteville, NC
Something went wrong! Please refresh the page.
| Fire incidents reported | |
|---|---|
| Sreet name | Count |
| RAEFORD RD | 748 |
| RAMSEY ST | 666 |
| CAMDEN RD | 578 |
| SKIBO RD | 554 |
| BRAGG BLVD | 524 |
| CEDAR CREEK RD | 416 |
| OWEN DR | 412 |
| MURCHISON RD | 410 |
| CUMBERLAND RD | 394 |
| CLIFFDALE RD | 386 |
| GILLESPIE ST | 342 |
| CLINTON RD | 328 |
| MORGANTON RD | 290 |
| EASTERN BLVD | 276 |
| HOPE MILLS RD | 248 |
| IRELAND DR | 230 |
| YADKIN RD | 224 |
| ROSEHILL RD | 220 |
| DUNN RD | 216 |
| WALDOS BEACH RD | 168 |
| ROCKFISH RD | 166 |
| BINGHAM DR | 164 |
| REILLY RD | 162 |
| STRICKLAND BRIDGE RD | 152 |
| FISHER RD | 140 |
| PERSON ST | 140 |
| ROBESON ST | 138 |
| I-95 | 136 |
| TABOR CHURCH RD | 134 |
| STONEY POINT RD | 132 |
| Other | 16,447 |
2002 - 2018 National Fire Incident Reporting System (NFIRS) incidents
- Incident types reported to NFIRS in Fayetteville, NC
- 113,17256.3%Rescue & EMS
- 25,54112.7%Fire
- 25,39112.6%Good Intent Call
- 13,6806.8%False Alarm
- 12,8366.4%Service Call
- 10,0385.0%Hazardous Condition
- 2560.1%Severe Weather
- Fire incident types reported to NFIRS in Fayetteville, NC
- 11,83546.3%Structure Fires
- 9,62737.7%Outside Fires
- 3,20912.6%Mobile Property/Vehicle Fires
- 8703.4%Other
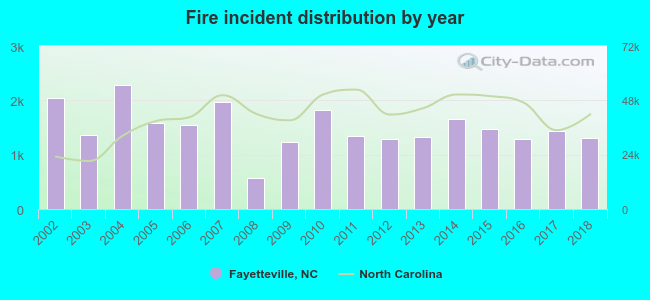 Based on the data from the years 2002 - 2018 the average number of fires per year is 1,502. The highest number of reported fires - 2,286 took place in 2004, and the least - 570 in 2008. The data has a declining trend.
The average number of yearly fire incidents per 10k residents in Fayetteville, NC compared to nearest cities:
(Note: Based on data for the last 3 years, including only cities with population 5,000 and above)
| Fayetteville: | 65.8 |
| Fort Bragg: | 0.3 |
| Hope Mills: | 205.7 |
| Spring Lake: | 144.1 |
| Dunn: | 217.0 |
| Southern Pines: | 88.4 |
| Aberdeen: | 178.1 |
| Lumberton: | 156.6 |
| Sanford: | 128.7 |
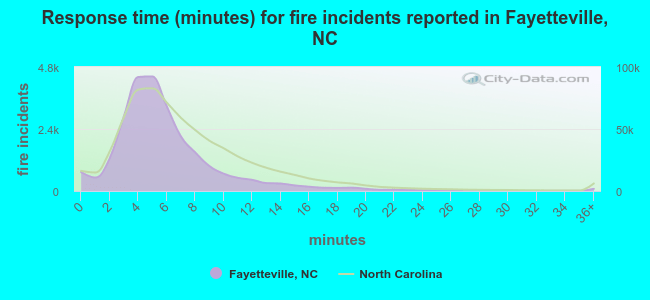 The median response time based on all reported fire incidents is 5 minutes. This is lower than the North Carolina median value.
The median response time in Fayetteville, NC compared to nearest cities:
(Note: Based on data for all years, including only cities with at least 500 fire incidents)
| Fayetteville: | 5 minutes |
| Hope Mills: | 7 minutes |
| Spring Lake: | 8 minutes |
| Wade: | 9 minutes |
| Parkton: | 9 minutes |
| Stedman: | 9 minutes |
| Lumber Bridge: | 10 minutes |
| Linden: | 10 minutes |
| Autryville: | 12 minutes |
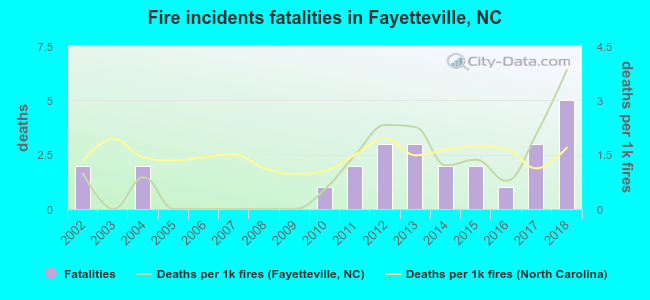 According to the data from the years 2002 - 2018 the average number of fire-related yearly deaths is 2. The highest number of deaths - 5 took place in 2018, and the lowest - 0 in 2003. The data has a growing trend.
The average number of deaths per 1,000 fires is 1. This indicator was the highest - 4 in 2018, and the lowest 0 in 2003. The trend for fatalities per 1,000 incidents is rising. Compared to the North Carolina value the number of deaths per 1,000 incidents is lower.
According to the data from the years 2002 - 2018 the average number of fire-related yearly deaths is 2. The highest number of deaths - 5 took place in 2018, and the lowest - 0 in 2003. The data has a growing trend.
The average number of deaths per 1,000 fires is 1. This indicator was the highest - 4 in 2018, and the lowest 0 in 2003. The trend for fatalities per 1,000 incidents is rising. Compared to the North Carolina value the number of deaths per 1,000 incidents is lower.Deaths per 1,000 incidents in Fayetteville, NC compared to nearest cities:
(Note: Based on data for all years, including only cities with at least 2,500 fire incidents)
| Fayetteville: | 1.0 |
| Hope Mills: | 0.7 |
| Spring Lake: | 0.8 |
| Raeford: | 0.0 |
| Lillington: | 2.1 |
| Dunn: | 1.5 |
| Cameron: | 0.3 |
| Lumberton: | 2.0 |
| Sanford: | 0.9 |
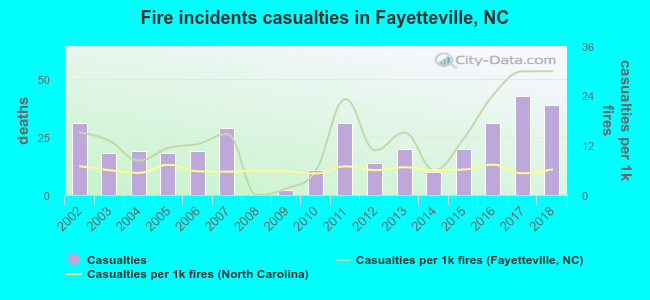 According to the reports from the years 2002 - 2018 the average number of fire-related yearly casualties is 21. The highest number of reported injuries - 43 took place in 2017, and the lowest - 0 in 2008. The data has a rising trend.
The average number of injuries per 1,000 fires is 14. This indicator was the highest - 30 in 2018, and the lowest 0 in 2008. The trend for casualties per 1,000 fires is growing. Compared to the state value the number of casualties per 1,000 incidents is much higher.
According to the reports from the years 2002 - 2018 the average number of fire-related yearly casualties is 21. The highest number of reported injuries - 43 took place in 2017, and the lowest - 0 in 2008. The data has a rising trend.
The average number of injuries per 1,000 fires is 14. This indicator was the highest - 30 in 2018, and the lowest 0 in 2008. The trend for casualties per 1,000 fires is growing. Compared to the state value the number of casualties per 1,000 incidents is much higher.Casualties per 1,000 incidents in Fayetteville, NC compared to nearest cities:
(Note: Based on data for all years, including only cities with at least 500 fire incidents)
| Fayetteville: | 13.9 |
| Hope Mills: | 2.7 |
| Spring Lake: | 1.1 |
| Wade: | 1.6 |
| Parkton: | 0.8 |
| Stedman: | 0.9 |
| Lumber Bridge: | 1.6 |
| Linden: | 0.0 |
| Autryville: | 0.0 |
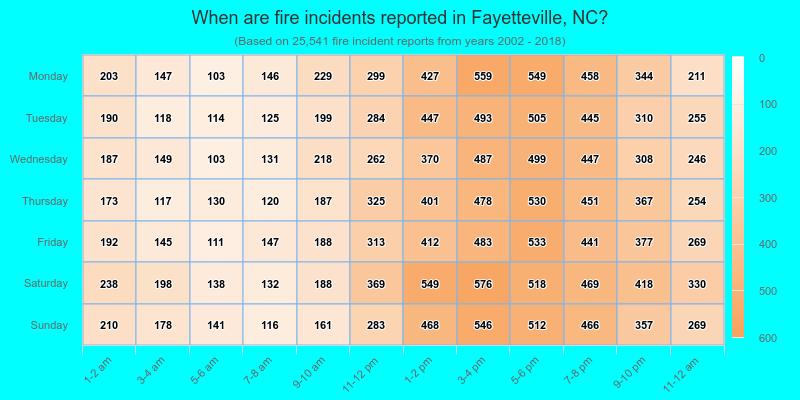
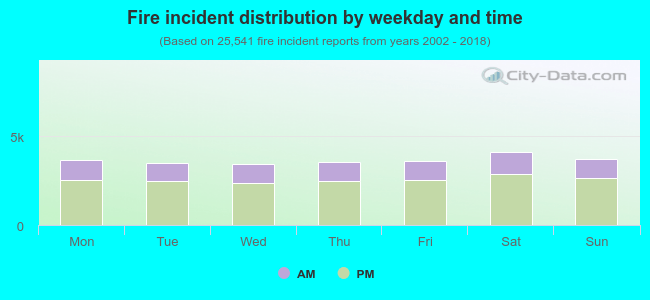 30.2% incidents where reported in the morning and 69.8% in the evening. The most fires (16.1%) took place on Saturday, and the least (13.3%) on Wednesday.
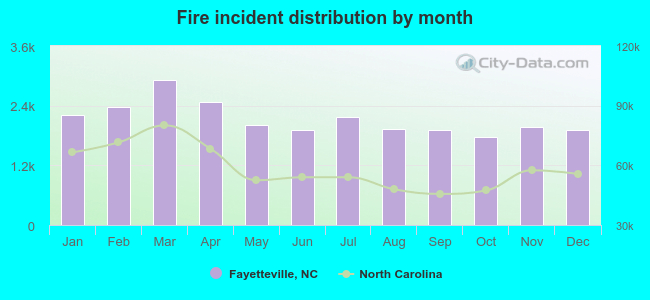 According to the 25,541 fire incident reports from years 2002 - 2018 most fires (11.4%) took place during March, and the least (6.9%) in October.
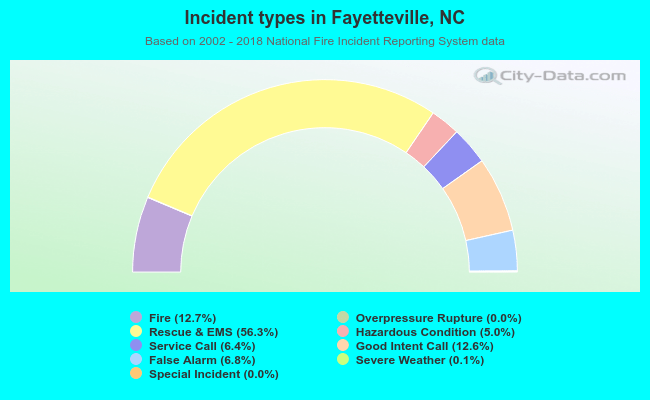 Out of all 201,079 cases reported during the years 2002 - 2018, the most belonged to the categories: Rescue & EMS (56.3%), Fire (12.7%), and Good Intent Call (12.6%).
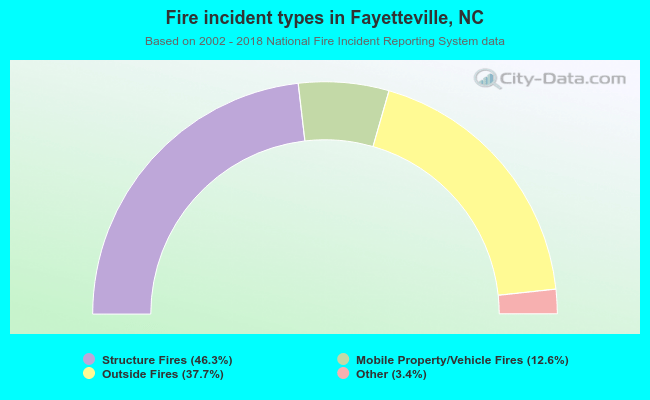 When looking into fire subcategories, the most incidents belonged to: Structure Fires (46.3%), and Outside Fires (37.7%).