Fort Lauderdale: Fire Incidents, Florida (FL)
Where are fire incidents reported in Fort Lauderdale, FL
Something went wrong! Please refresh the page.
| Fire incidents reported | |
|---|---|
| Sreet name | Count |
| FEDERAL HWY | 366 |
| SUNRISE BLVD | 274 |
| BROWARD BLVD | 222 |
| 4TH AVE | 216 |
| 9TH AVE | 186 |
| ANDREWS AVE | 154 |
| DAVIE BLVD | 144 |
| 17TH ST | 140 |
| NBI95 | 136 |
| COMMERCIAL BLVD | 126 |
| 19TH ST | 124 |
| 2ND ST | 112 |
| 15TH AVE | 108 |
| 18TH AVE | 106 |
| SBI95 | 100 |
| 3RD AVE | 96 |
| 15TH ST | 94 |
| LAS OLAS BLVD | 94 |
| 62ND ST | 92 |
| 7TH AVE | 92 |
| ATLANTIC BLVD | 92 |
| 1ST AVE | 88 |
| 8TH AVE | 84 |
| 6TH ST | 82 |
| 20TH ST | 80 |
| 5TH AVE | 80 |
| SEABREEZE BLVD | 80 |
| 7TH ST | 78 |
| 10TH AVE | 76 |
| 16TH ST | 76 |
| Other | 999 |
2002 - 2018 National Fire Incident Reporting System (NFIRS) incidents
- Incident types reported to NFIRS in Fort Lauderdale, FL
- 95,64067.2%Rescue & EMS
- 14,0949.9%Good Intent Call
- 10,0697.1%Service Call
- 9,4246.6%False Alarm
- 7,3965.2%Hazardous Condition
- 4,7973.4%Fire
- 9180.6%Special Incident
- Fire incident types reported to NFIRS in Fort Lauderdale, FL
- 1,89139.4%Structure Fires
- 1,55432.4%Outside Fires
- 1,16724.3%Mobile Property/Vehicle Fires
- 1853.9%Other
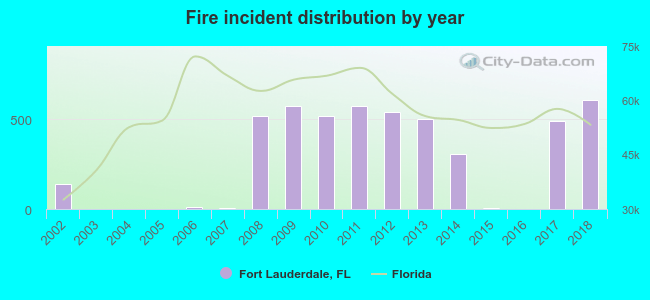 According to the data from the years 2002 - 2018 the average number of fire incidents per year is 282. The highest number of reported fire incidents - 606 took place in 2018, and the least - 0 in 2016. The data has an increasing trend.
The average number of yearly fire incidents per 10k residents in Fort Lauderdale, FL compared to nearest cities:
(Note: Based on data for the last 3 years, including only cities with population 5,000 and above)
| Fort Lauderdale: | 31.2 |
| Wilton Manors: | 22.3 |
| Oakland Park: | 32.1 |
| Lauderdale Lakes: | 22.5 |
| Dania Beach: | 0.5 |
| Lauderhill: | 24.5 |
| Plantation: | 10.4 |
| Pompano Beach: | 20.2 |
| North Lauderdale: | 19.9 |
 The median response time based on all reported fire incidents is 5 minutes. This is lower compared to the Florida median value.
The median response time in Fort Lauderdale, FL compared to nearest cities:
(Note: Based on data for all years, including only cities with at least 500 fire incidents)
| Fort Lauderdale: | 5 minutes |
| Oakland Park: | 5 minutes |
| Lauderdale Lakes: | 6 minutes |
| Lauderhill: | 6 minutes |
| Plantation: | 7 minutes |
| Pompano Beach: | 6 minutes |
| North Lauderdale: | 5 minutes |
| Tamarac: | 6 minutes |
| Hollywood: | 6 minutes |
 Based on the data from the years 2002 - 2018 the average number of fire-related yearly deaths is 0. The highest number of reported deaths - 2 took place in 2017, and the lowest - 0 in 2002. The data has a growing trend.
The average number of fatalities per 1,000 fire incidents is 1. This indicator was the highest - 4 in 2017, and the lowest 0 in 2002. The trend for deaths per 1,000 fires is rising. Compared to the state value the number of fatalities per 1,000 incidents is much lower.
Based on the data from the years 2002 - 2018 the average number of fire-related yearly deaths is 0. The highest number of reported deaths - 2 took place in 2017, and the lowest - 0 in 2002. The data has a growing trend.
The average number of fatalities per 1,000 fire incidents is 1. This indicator was the highest - 4 in 2017, and the lowest 0 in 2002. The trend for deaths per 1,000 fires is rising. Compared to the state value the number of fatalities per 1,000 incidents is much lower.Deaths per 1,000 incidents in Fort Lauderdale, FL compared to nearest cities:
(Note: Based on data for all years, including only cities with at least 2,500 fire incidents)
| Fort Lauderdale: | 0.8 |
| Lauderhill: | 2.3 |
| Plantation: | 0.4 |
| Hollywood: | 1.1 |
| Davie: | 0.8 |
| Miami Gardens: | 0.0 |
| Coral Springs: | 0.6 |
| Pembroke Pines: | 1.4 |
 According to the data from the years 2002 - 2018 the average number of fire-related yearly casualties is 3. The highest number of reported injuries - 11 took place in 2013, and the lowest - 0 in 2002. The data has a growing trend.
The average number of casualties per 1,000 fire incidents is 5. This indicator was the highest - 22 in 2013, and the lowest 0 in 2002. The trend for casualties per 1,000 fire incidents is increasing. Compared to the Florida value the number of injuries per 1,000 fire incidents is lower.
According to the data from the years 2002 - 2018 the average number of fire-related yearly casualties is 3. The highest number of reported injuries - 11 took place in 2013, and the lowest - 0 in 2002. The data has a growing trend.
The average number of casualties per 1,000 fire incidents is 5. This indicator was the highest - 22 in 2013, and the lowest 0 in 2002. The trend for casualties per 1,000 fire incidents is increasing. Compared to the Florida value the number of injuries per 1,000 fire incidents is lower.Casualties per 1,000 incidents in Fort Lauderdale, FL compared to nearest cities:
(Note: Based on data for all years, including only cities with at least 500 fire incidents)
| Fort Lauderdale: | 9.8 |
| Oakland Park: | 0.5 |
| Lauderdale Lakes: | 31.3 |
| Lauderhill: | 39.2 |
| Plantation: | 6.6 |
| Pompano Beach: | 41.3 |
| North Lauderdale: | 7.7 |
| Tamarac: | 7.1 |
| Hollywood: | 17.4 |
 36.1% incidents where reported in the morning and 63.9% in the evening. The most fires (14.9%) took place on Monday, and the least (13.4%) on Thursday.
 According to the 4,797 reports from years 2002 - 2018 most fires (11.0%) took place during March, and the least (6.3%) in August.
 Out of all 142,421 cases reported during the years 2002 - 2018, the most belonged to the categories: Rescue & EMS (67.2%), Good Intent Call (9.9%), and Service Call (7.1%).
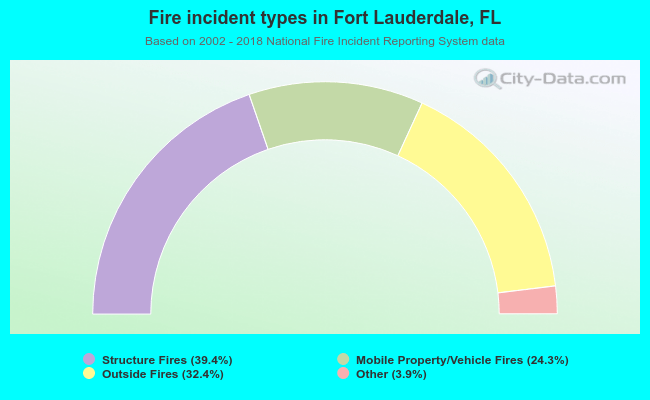 When looking into fire subcategories, the most reports belonged to: Structure Fires (39.4%), and Outside Fires (32.4%).