Frankfort: Fire Incidents, Indiana (IN)
Where are fire incidents reported in Frankfort, IN
Something went wrong! Please refresh the page.
|
| |||||||||||||||||||||||||||||||||||||||||||||||||||||||||||||||||||||||||||||||||||||||||||||||||||||||||||||
| Other | 261 | |||||||||||||||||||||||||||||||||||||||||||||||||||||||||||||||||||||||||||||||||||||||||||||||||||||||||||||
2002 - 2017 National Fire Incident Reporting System (NFIRS) incidents
- Incident types reported to NFIRS in Frankfort, IN
- 1,23531.5%Rescue & EMS
- 1,15129.3%Fire
- 57414.6%Hazardous Condition
- 39210.0%Good Intent Call
- 2546.5%Service Call
- 1995.1%Special Incident
- 1112.8%False Alarm
- 60.2%Severe Weather
- Fire incident types reported to NFIRS in Frankfort, IN
- 44738.8%Outside Fires
- 38033.0%Structure Fires
- 16514.3%Other
- 15913.8%Mobile Property/Vehicle Fires
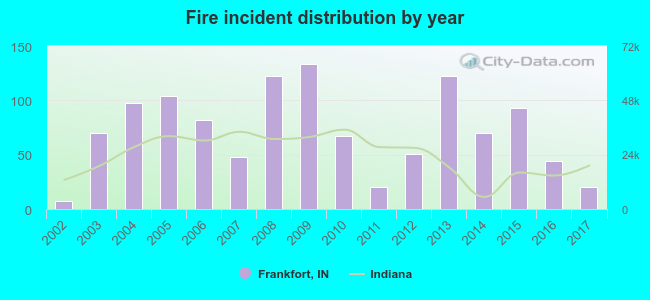 According to the data from the years 2002 - 2017 the average number of fire incidents per year is 72. The highest number of reported fire incidents - 133 took place in 2009, and the least - 7 in 2002. The data has an increasing trend.
The average number of yearly fire incidents per 10k residents in Frankfort, IN compared to nearest cities:
(Note: Based on data for the last 3 years, including only cities with population 5,000 and above)
| Frankfort: | 19.8 |
| Lebanon: | 10.9 |
| Lafayette: | 13.1 |
| Whitestown: | 40.6 |
| West Lafayette: | 30.1 |
| Kokomo: | 21.9 |
| Tipton: | 89.2 |
| Zionsville: | 16.1 |
| Crawfordsville: | 5.3 |
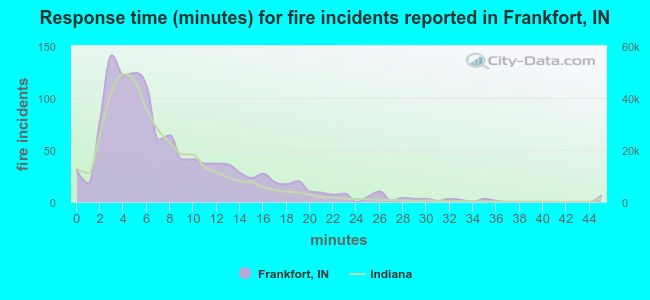 The median response time based on all reported fire incidents is 6 minutes. This is similar to the state median value.
The median response time in Frankfort, IN compared to nearest cities:
(Note: Based on data for all years, including only cities with at least 500 fire incidents)
| Frankfort: | 6 minutes |
| Lebanon: | 5 minutes |
| Sheridan: | 8 minutes |
| Lafayette: | 4 minutes |
| Delphi: | 9 minutes |
| West Lafayette: | 4 minutes |
| Kokomo: | 5 minutes |
| Tipton: | 5 minutes |
| Zionsville: | 6 minutes |
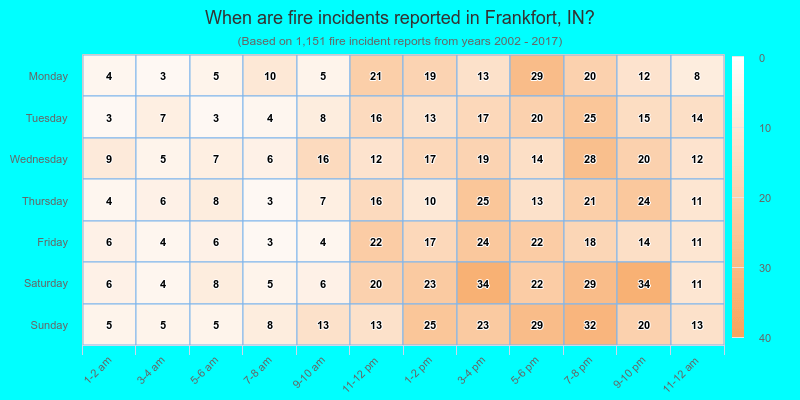
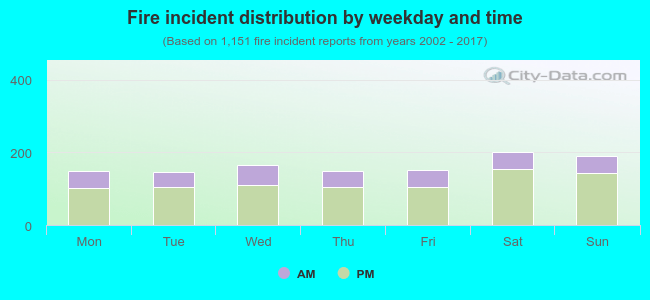 28.8% incidents where reported in the morning and 71.2% in the evening. The most fires (17.5%) took place on Saturday, and the least (12.6%) on Tuesday.
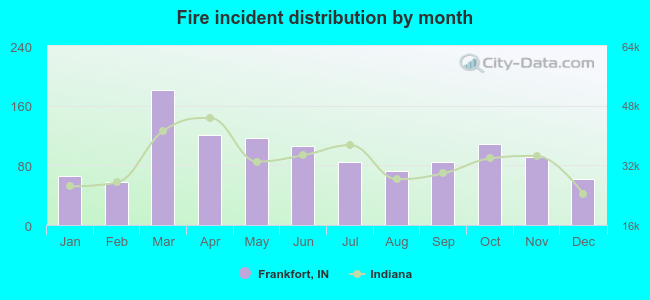 According to the 1,151 reports from years 2002 - 2017 most fires (15.7%) took place during March, and the least (5.0%) in February.
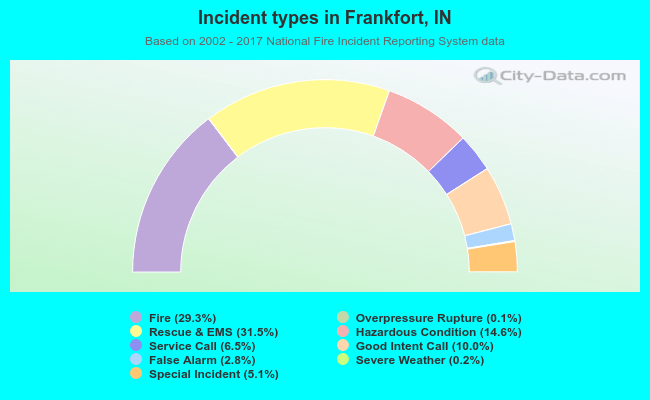 Out of all 3,925 cases reported during the years 2002 - 2017, the most belonged to the categories: Rescue & EMS (31.5%), Fire (29.3%), and Hazardous Condition (14.6%).
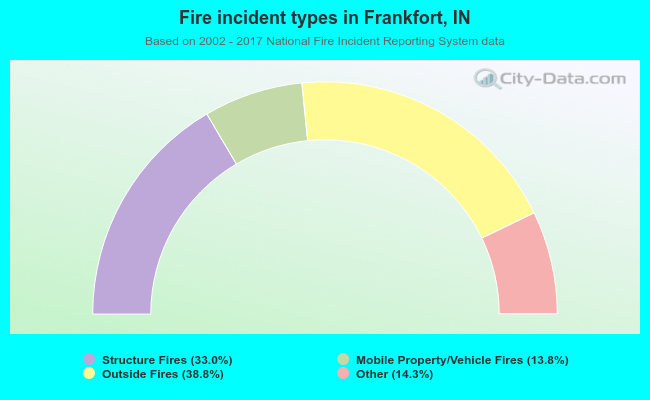 When looking into fire subcategories, the most reports belonged to: Outside Fires (38.8%), and Structure Fires (33.0%).