Freeville: Fire Incidents, New York (NY)
Where are fire incidents reported in Freeville, NY
Something went wrong! Please refresh the page.
|
| |||||||||||||||||||||||||||||||||||||||||||||||||||||||||||||||||||||||||||||||||||||||||||||||||||||||||||||
2002 - 2018 National Fire Incident Reporting System (NFIRS) incidents
- Incident types reported to NFIRS in Freeville, NY
- 1,02545.0%Rescue & EMS
- 43619.1%False Alarm
- 28712.6%Service Call
- 1787.8%Hazardous Condition
- 1767.7%Fire
- 1586.9%Good Intent Call
- 160.7%Severe Weather
- 30.1%Special Incident
- Fire incident types reported to NFIRS in Freeville, NY
- 8548.3%Structure Fires
- 5330.1%Outside Fires
- 3017.0%Mobile Property/Vehicle Fires
- 84.5%Other
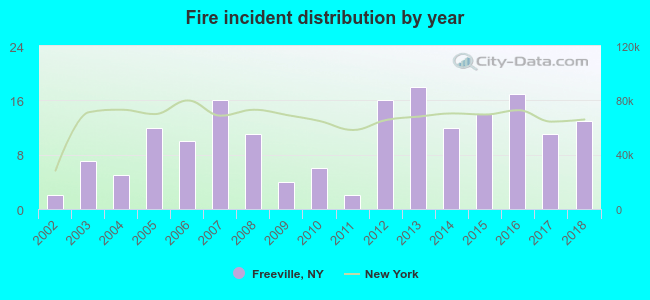 According to the data from the years 2002 - 2018 the average number of fires per year is 10. The highest number of reported fire incidents - 18 took place in 2013, and the least - 2 in 2002. The data has an increasing trend.
 36.4% incidents where reported in the morning and 63.6% in the evening. The most fires (18.2%) took place on Tuesday, and the least (11.4%) on Friday.
 According to the 176 incident reports from years 2002 - 2018 most fires (19.9%) took place during April, and the least (1.7%) in September.
 Out of all 2,280 cases reported during the years 2002 - 2018, the most belonged to the categories: Rescue & EMS (45.0%), False Alarm (19.1%), and Service Call (12.6%).
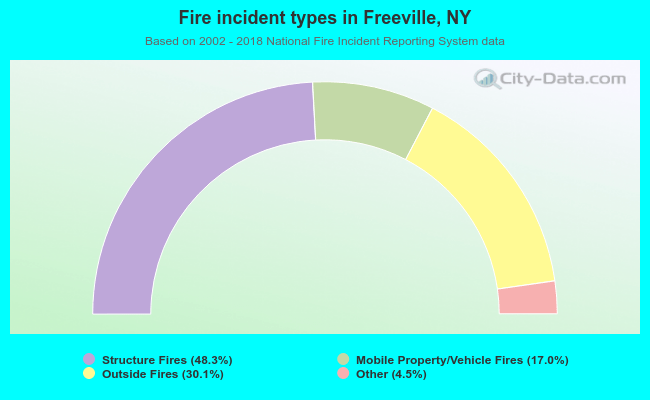 When looking into fire subcategories, the most reports belonged to: Structure Fires (48.3%), and Outside Fires (30.1%).