Friendswood: Fire Incidents, Texas (TX)
Where are fire incidents reported in Friendswood, TX
Something went wrong! Please refresh the page.
| Fire incidents reported | |
|---|---|
| Sreet name | Count |
| FM 2351 | 100 |
| PARKWOOD AVE | 90 |
| FRIENDSWOOD DR | 84 |
| BAY AREA BLVD | 80 |
| FM 528 | 60 |
| BLACKHAWK BLVD | 56 |
| BLACKHAWK | 50 |
| BEAMER RD | 26 |
| EDGEWOOD DR | 26 |
| BOUGAINVILLA LN | 22 |
| CASTLE HARBOUR DR | 22 |
| LUNDY LN | 22 |
| CASTLELAKE DR | 20 |
| DUNBAR ESTATES DR | 20 |
| TIBET RD | 20 |
| WATKINS WAY | 20 |
| FOREST BEND AVE | 18 |
| PILGRIMS POINT DR | 18 |
| WATKINS WAY | 18 |
| WINDSONG LN | 18 |
| DESERET DR | 16 |
| HOPE VILLAGE | 16 |
| BEACONS VIEW | 14 |
| BOUGAINVILLA | 14 |
| COWARDS CREEK DR | 14 |
| MOSSY STONE DR | 14 |
| PARKWOOD | 14 |
| STRATMORE DR | 14 |
| DUNBAR ESTATES | 12 |
| E. PARKWOOD | 12 |
| Other | 584 |
2002 - 2018 National Fire Incident Reporting System (NFIRS) incidents
- Incident types reported to NFIRS in Friendswood, TX
- 15,65569.4%Rescue & EMS
- 2,65711.8%Hazardous Condition
- 1,5146.7%Fire
- 1,3045.8%False Alarm
- 8934.0%Good Intent Call
- 4962.2%Service Call
- 230.1%Overpressure Rupture
- 230.1%Severe Weather
- Fire incident types reported to NFIRS in Friendswood, TX
- 65643.3%Structure Fires
- 60239.8%Outside Fires
- 17911.8%Mobile Property/Vehicle Fires
- 775.1%Other
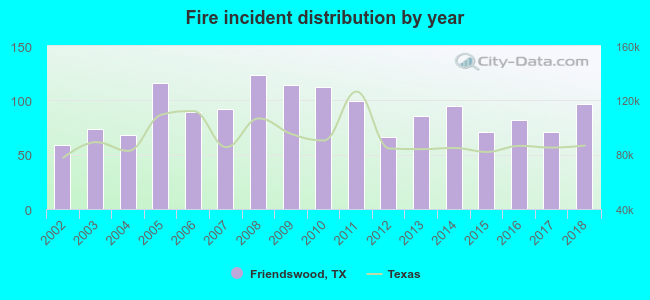 According to the data from the years 2002 - 2018 the average number of fires per year is 89. The highest number of fires - 123 took place in 2008, and the least - 59 in 2002. The data has a growing trend.
The average number of yearly fire incidents per 10k residents in Friendswood, TX compared to nearest cities:
(Note: Based on data for the last 3 years, including only cities with population 5,000 and above)
| Friendswood: | 21.8 |
| Webster: | 63.6 |
| League City: | 15.7 |
| Pearland: | 15.1 |
| Alvin: | 57.1 |
| Dickinson: | 40.8 |
| Manvel: | 42.3 |
| South Houston: | 1.1 |
| Santa Fe: | 71.3 |
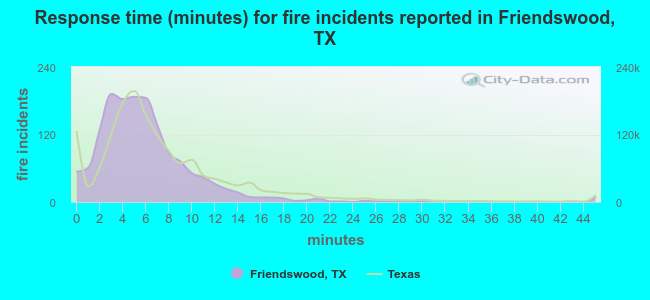 The median response time based on all reported fire incidents is 5 minutes. This is lower than the Texas median value.
The median response time in Friendswood, TX compared to nearest cities:
(Note: Based on data for all years, including only cities with at least 500 fire incidents)
| Friendswood: | 5 minutes |
| Webster: | 5 minutes |
| League City: | 7 minutes |
| Pearland: | 7 minutes |
| Alvin: | 7 minutes |
| Dickinson: | 6 minutes |
| Manvel: | 7 minutes |
| Santa Fe: | 7 minutes |
| Seabrook: | 8 minutes |
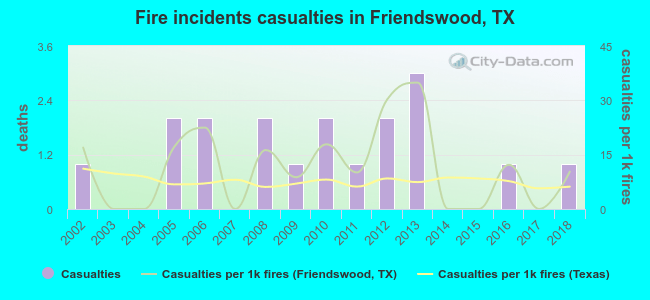 Based on the data from the years 2002 - 2018 the average number of fire-related yearly casualties is 1. The highest number of reported injuries - 3 took place in 2013, and the lowest - 0 in 2003. The data has a constant trend.
The average number of casualties per 1,000 fires is 12. This indicator was the highest - 35 in 2013, and the lowest 0 in 2003. The trend for casualties per 1,000 fire incidents is dropping. Compared to the state value the number of casualties per 1,000 fire incidents is higher.
Based on the data from the years 2002 - 2018 the average number of fire-related yearly casualties is 1. The highest number of reported injuries - 3 took place in 2013, and the lowest - 0 in 2003. The data has a constant trend.
The average number of casualties per 1,000 fires is 12. This indicator was the highest - 35 in 2013, and the lowest 0 in 2003. The trend for casualties per 1,000 fire incidents is dropping. Compared to the state value the number of casualties per 1,000 fire incidents is higher.
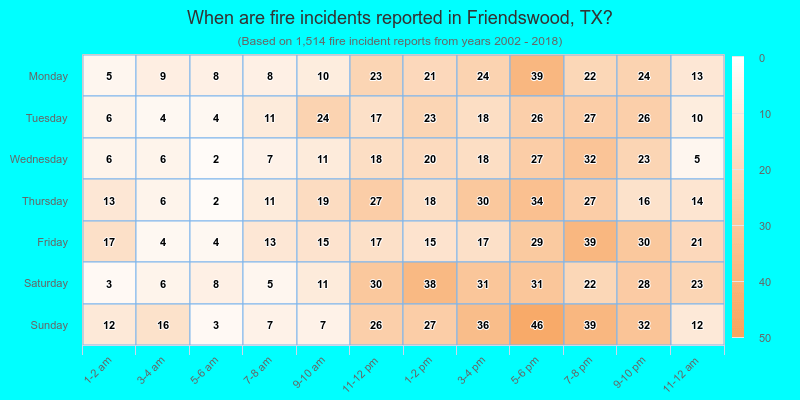
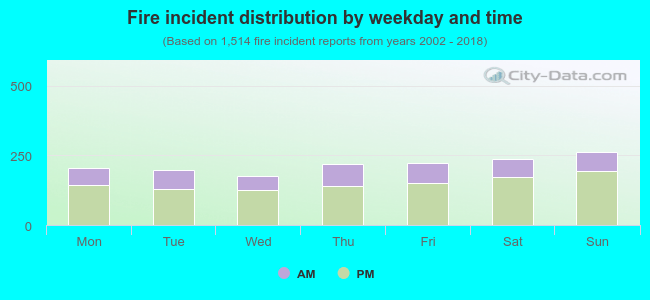 30.4% incidents where reported in the morning and 69.6% in the evening. The most fires (17.4%) took place on Sunday, and the least (11.6%) on Wednesday.
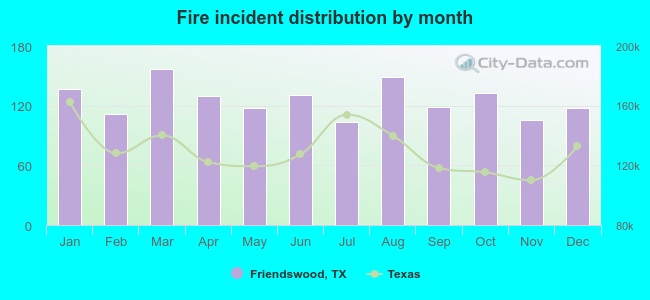 Based on the 1,514 incident reports from years 2002 - 2018 most fires (10.4%) took place during March, and the least (6.9%) in July.
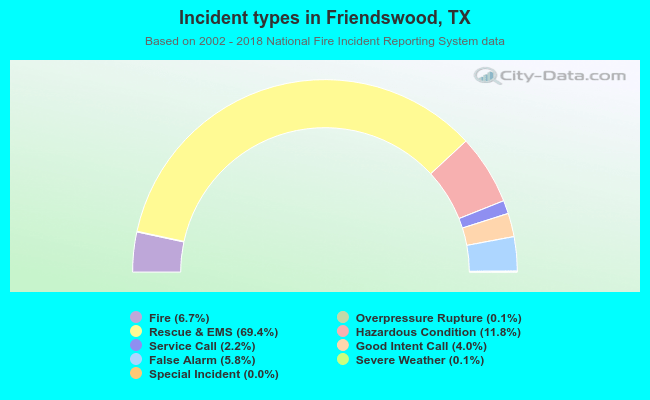 Out of all 22,568 cases reported during the years 2002 - 2018, the most belonged to the categories: Rescue & EMS (69.4%), Hazardous Condition (11.8%), and Fire (6.7%).
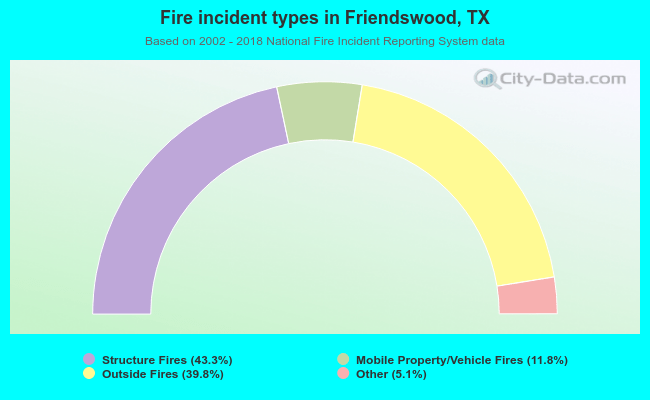 When looking into fire subcategories, the most incidents belonged to: Structure Fires (43.3%), and Outside Fires (39.8%).