Fullerton: Fire Incidents, California (CA)
Where are fire incidents reported in Fullerton, CA
Something went wrong! Please refresh the page.
| Fire incidents reported | |
|---|---|
| Sreet name | Count |
| ORANGETHORPE AVE | 200 |
| COMMONWEALTH AVE | 146 |
| HARBOR BLVD | 108 |
| VALENCIA DR | 68 |
| CHAPMAN AVE | 50 |
| VALENCIA | 50 |
| STATE COLLEGE BLVD | 48 |
| WALNUT AVE | 46 |
| MALVERN AVE | 44 |
| YORBA LINDA BLVD | 44 |
| HIGHLAND AVE | 40 |
| WEST AVE | 40 |
| NUTWOOD AVE | 34 |
| WILSHIRE AVE | 34 |
| DEERPARK DR | 32 |
| RICHMAN AVE | 30 |
| SANTA FE AVE | 30 |
| ACACIA AVE | 28 |
| ASSOCIATED RD | 28 |
| GILBERT | 26 |
| GILBERT ST | 26 |
| RAYMOND AVE | 26 |
| HOUSTON AVE | 24 |
| STATE COLLEGE | 24 |
| WILLIAMSON AVE | 24 |
| AMERIGE AVE | 22 |
| ASH AVE | 22 |
| ASSOCIATED | 22 |
| BAKER AVE | 22 |
| BASTANCHURY RD | 22 |
| Other | 612 |
2005 - 2018 National Fire Incident Reporting System (NFIRS) incidents
- Incident types reported to NFIRS in Fullerton, CA
- 26,21161.4%Rescue & EMS
- 8,67420.3%Good Intent Call
- 3,0867.2%Service Call
- 1,9724.6%Fire
- 1,3663.2%False Alarm
- 1,3533.2%Hazardous Condition
- Fire incident types reported to NFIRS in Fullerton, CA
- 83142.1%Outside Fires
- 60930.9%Structure Fires
- 33416.9%Mobile Property/Vehicle Fires
- 19810.0%Other
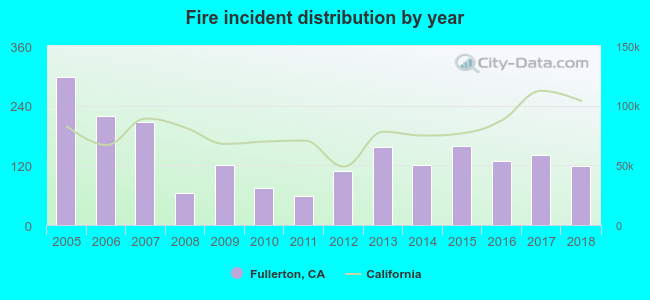 Based on the data from the years 2005 - 2018 the average number of fires per year is 141. The highest number of fire incidents - 297 took place in 2005, and the least - 59 in 2011. The data has a declining trend.
The average number of yearly fire incidents per 10k residents in Fullerton, CA compared to nearest cities:
(Note: Based on data for the last 3 years, including only cities with population 5,000 and above)
| Fullerton: | 9.2 |
| La Habra: | 10.7 |
| Anaheim: | 11.0 |
| Brea: | 14.2 |
| Placentia: | 8.7 |
| Buena Park: | 14.2 |
| La Mirada: | 7.6 |
| La Habra Heights: | 18.9 |
| Stanton: | 12.4 |
 The median response time based on all reported fire incidents is 6 minutes. This is close to the California median value.
The median response time in Fullerton, CA compared to nearest cities:
(Note: Based on data for all years, including only cities with at least 500 fire incidents)
| Fullerton: | 6 minutes |
| La Habra: | 5 minutes |
| Anaheim: | 6 minutes |
| Placentia: | 5 minutes |
| Buena Park: | 5 minutes |
| La Mirada: | 5 minutes |
| Stanton: | 5 minutes |
| Garden Grove: | 6 minutes |
| Cypress: | 5 minutes |
 Based on the data from the years 2005 - 2018 the average number of fire-related yearly casualties is 1. The highest number of injuries - 4 took place in 2005, and the lowest - 0 in 2007. The data has a dropping trend.
The average number of injuries per 1,000 fires is 5. This indicator was the highest - 27 in 2010, and the lowest 0 in 2007. The trend for injuries per 1,000 fire incidents is declining. Compared to the California value the number of injuries per 1,000 fires is about the same.
Based on the data from the years 2005 - 2018 the average number of fire-related yearly casualties is 1. The highest number of injuries - 4 took place in 2005, and the lowest - 0 in 2007. The data has a dropping trend.
The average number of injuries per 1,000 fires is 5. This indicator was the highest - 27 in 2010, and the lowest 0 in 2007. The trend for injuries per 1,000 fire incidents is declining. Compared to the California value the number of injuries per 1,000 fires is about the same.Casualties per 1,000 incidents in Fullerton, CA compared to nearest cities:
(Note: Based on data for all years, including only cities with at least 500 fire incidents)
| Fullerton: | 5.1 |
| La Habra: | 0.0 |
| Anaheim: | 4.3 |
| Placentia: | 15.9 |
| Buena Park: | 22.3 |
| La Mirada: | 0.0 |
| Stanton: | 24.7 |
| Garden Grove: | 24.0 |
| Cypress: | 24.5 |
 32.7% incidents where reported in the morning and 67.3% in the evening. The most fires (16.5%) took place on Sunday, and the least (13.0%) on Thursday.
 Based on the 1,972 incident reports from years 2005 - 2018 most fires (11.4%) took place during July, and the least (5.2%) in November.
 Out of all 42,713 cases reported during the years 2005 - 2018, the most belonged to the categories: Rescue & EMS (61.4%), Good Intent Call (20.3%), and Service Call (7.2%).
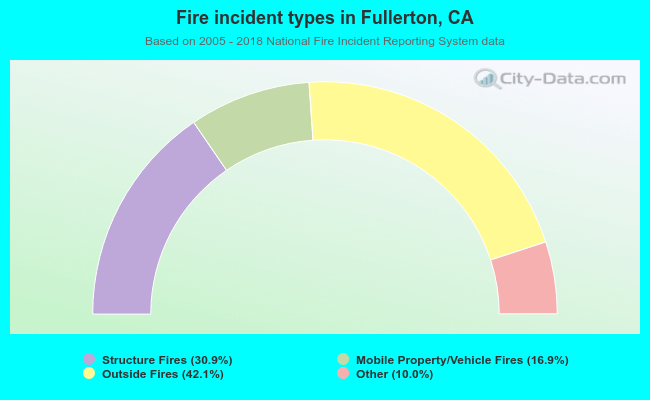 When looking into fire subcategories, the most incidents belonged to: Outside Fires (42.1%), and Structure Fires (30.9%).