Galveston: Fire Incidents, Texas (TX)
Where are fire incidents reported in Galveston, TX
Something went wrong! Please refresh the page.
| Fire incidents reported | |
|---|---|
| Sreet name | Count |
| AVE J | 812 |
| SEAWALL BLVD | 630 |
| FM 3005 | 602 |
| HARBORSIDE DR | 328 |
| STEWART RD | 270 |
| SEAWALL BV | 228 |
| AVE G | 204 |
| AVE H | 192 |
| AVE F | 188 |
| AVE O | 184 |
| 61ST ST | 172 |
| AVE L | 164 |
| AVE P | 158 |
| AVE K | 150 |
| AVE S | 144 |
| AVE Q | 142 |
| AVE M | 138 |
| AVE D | 136 |
| AVE I | 126 |
| AVE E | 124 |
| AVE R | 106 |
| JONES DR | 102 |
| EAST BEACH DR | 100 |
| AVE B | 98 |
| AVE N | 92 |
| 69TH ST | 90 |
| 21ST ST | 82 |
| COVE VIEW BLVD | 82 |
| AVE P 1/2 | 80 |
| AVE C | 74 |
2002 - 2018 National Fire Incident Reporting System (NFIRS) incidents
- Incident types reported to NFIRS in Galveston, TX
- 25,61350.4%Rescue & EMS
- 6,72513.2%Good Intent Call
- 6,61313.0%Hazardous Condition
- 5,82711.5%Fire
- 4,4348.7%False Alarm
- 1,4122.8%Service Call
- 1050.2%Special Incident
- Fire incident types reported to NFIRS in Galveston, TX
- 2,58444.3%Outside Fires
- 2,22138.1%Structure Fires
- 89615.4%Mobile Property/Vehicle Fires
- 1262.2%Other
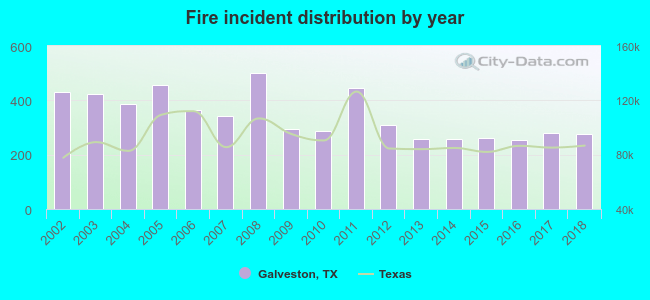 According to the data from the years 2002 - 2018 the average number of fire incidents per year is 343. The highest number of fire incidents - 500 took place in 2008, and the least - 254 in 2016. The data has a dropping trend.
The average number of yearly fire incidents per 10k residents in Galveston, TX compared to nearest cities:
(Note: Based on data for the last 3 years, including only cities with population 5,000 and above)
| Galveston: | 54.6 |
| Texas City: | 44.2 |
| La Marque: | 41.9 |
| Hitchcock: | 44.3 |
| Santa Fe: | 71.3 |
| Bacliff: | 40.6 |
| Dickinson: | 40.8 |
| League City: | 15.7 |
| Seabrook: | 13.6 |
 The median response time based on all reported fire incidents is 4 minutes. This is lower than the Texas median value.
The median response time in Galveston, TX compared to nearest cities:
(Note: Based on data for all years, including only cities with at least 500 fire incidents)
| Galveston: | 4 minutes |
| Texas City: | 6 minutes |
| La Marque: | 5 minutes |
| Hitchcock: | 8 minutes |
| Santa Fe: | 7 minutes |
| Dickinson: | 6 minutes |
| League City: | 7 minutes |
| Seabrook: | 8 minutes |
| Webster: | 5 minutes |
 According to the reports from the years 2002 - 2018 the average number of fire-related yearly deaths is 1. The highest number of deaths - 3 took place in 2006, and the lowest - 0 in 2004. The data has a dropping trend.
The average number of deaths per 1,000 fires is 2. This indicator was the highest - 8 in 2006, and the lowest 0 in 2004. The trend for deaths per 1,000 incidents is decreasing. Compared to the state value the number of fatalities per 1,000 fire incidents is higher.
According to the reports from the years 2002 - 2018 the average number of fire-related yearly deaths is 1. The highest number of deaths - 3 took place in 2006, and the lowest - 0 in 2004. The data has a dropping trend.
The average number of deaths per 1,000 fires is 2. This indicator was the highest - 8 in 2006, and the lowest 0 in 2004. The trend for deaths per 1,000 incidents is decreasing. Compared to the state value the number of fatalities per 1,000 fire incidents is higher.Deaths per 1,000 incidents in Galveston, TX compared to nearest cities:
(Note: Based on data for all years, including only cities with at least 2,500 fire incidents)
| Galveston: | 2.1 |
| Texas City: | 3.8 |
| Alvin: | 0.0 |
| Baytown: | 2.5 |
| Pearland: | 1.2 |
| Pasadena: | 1.3 |
| Channelview: | 3.8 |
| Crosby: | 2.0 |
| Houston: | 1.6 |
 Based on the reports from the years 2002 - 2018 the average number of fire-related yearly casualties is 9. The highest number of casualties - 26 took place in 2006, and the lowest - 3 in 2011. The data has a decreasing trend.
The average number of casualties per 1,000 fires is 27. This indicator was the highest - 71 in 2006, and the lowest 7 in 2011. The trend for injuries per 1,000 fire incidents is decreasing. Compared to the state value the number of injuries per 1,000 incidents is much higher.
Based on the reports from the years 2002 - 2018 the average number of fire-related yearly casualties is 9. The highest number of casualties - 26 took place in 2006, and the lowest - 3 in 2011. The data has a decreasing trend.
The average number of casualties per 1,000 fires is 27. This indicator was the highest - 71 in 2006, and the lowest 7 in 2011. The trend for injuries per 1,000 fire incidents is decreasing. Compared to the state value the number of injuries per 1,000 incidents is much higher.Casualties per 1,000 incidents in Galveston, TX compared to nearest cities:
(Note: Based on data for all years, including only cities with at least 500 fire incidents)
| Galveston: | 27.6 |
| Texas City: | 4.2 |
| La Marque: | 10.2 |
| Hitchcock: | 1.3 |
| Santa Fe: | 2.9 |
| Dickinson: | 11.5 |
| League City: | 10.1 |
| Seabrook: | 3.6 |
| Webster: | 10.9 |
 36.3% incidents where reported in the morning and 63.7% in the evening. The most fires (17.0%) took place on Saturday, and the least (12.6%) on Thursday.
 Based on the 5,827 incident reports from years 2002 - 2018 most fires (10.9%) took place during May, and the least (6.4%) in December.
 Out of all 50,792 cases reported during the years 2002 - 2018, the most belonged to the categories: Rescue & EMS (50.4%), Good Intent Call (13.2%), and Hazardous Condition (13.0%).
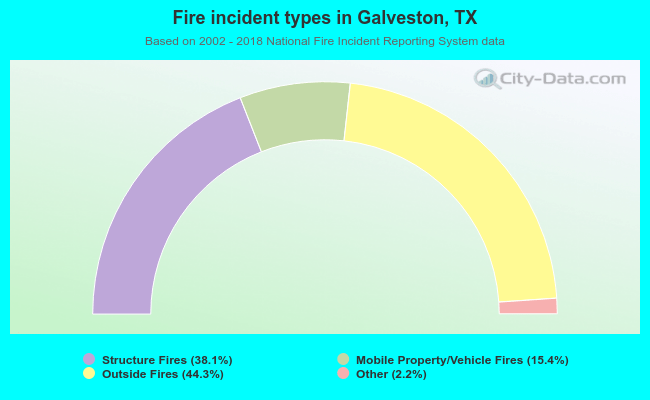 When looking into fire subcategories, the most incidents belonged to: Outside Fires (44.3%), and Structure Fires (38.1%).