Garden City: Fire Incidents, Idaho (ID)
Where are fire incidents reported in Garden City, ID
Something went wrong! Please refresh the page.
| Fire incidents reported | |
|---|---|
| Sreet name | Count |
| CHINDEN BL | 110 |
| GLENWOOD ST | 80 |
| ADAMS ST | 60 |
| 40TH ST | 54 |
| 44TH ST | 54 |
| 45TH ST | 48 |
| CHINDEN BLVD | 48 |
| 42ND ST | 46 |
| STATE ST | 46 |
| CHINDEN | 40 |
| 43RD ST | 36 |
| 37TH ST | 32 |
| 47TH ST | 32 |
| CHINDEN BLVD. | 30 |
| 41ST ST | 28 |
| 46TH ST | 28 |
| 50TH ST | 28 |
| GARRETT ST | 26 |
| 39TH ST | 22 |
| 36TH ST | 20 |
| 52ND ST | 18 |
| ALWORTH ST | 18 |
| CARTWRIGHT RD | 16 |
| DUCK LAKE DR | 16 |
| VMP | 16 |
| 38TH ST | 14 |
| 34TH ST | 12 |
| REED ST | 12 |
| 44TH | 10 |
| 49TH ST | 10 |
2002 - 2018 National Fire Incident Reporting System (NFIRS) incidents
- Incident types reported to NFIRS in Garden City, ID
- 4,20350.2%Rescue & EMS
- 1,23414.7%Good Intent Call
- 94011.2%Fire
- 93511.2%Service Call
- 5606.7%Hazardous Condition
- 4815.7%False Alarm
- 110.1%Overpressure Rupture
- Fire incident types reported to NFIRS in Garden City, ID
- 45848.7%Outside Fires
- 29131.0%Structure Fires
- 13514.4%Mobile Property/Vehicle Fires
- 566.0%Other
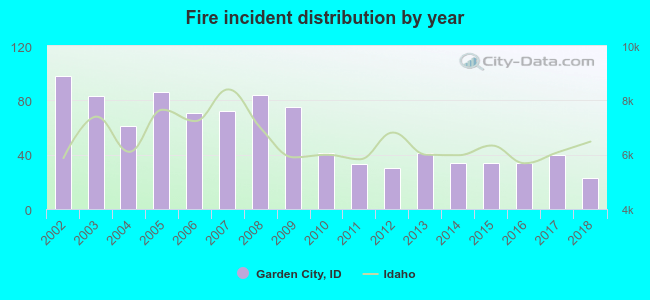 According to the data from the years 2002 - 2018 the average number of fire incidents per year is 55. The highest number of fires - 98 took place in 2002, and the least - 23 in 2018. The data has a declining trend.
The average number of yearly fire incidents per 10k residents in Garden City, ID compared to nearest cities:
(Note: Based on data for the last 3 years, including only cities with population 5,000 and above)
| Garden City: | 28.3 |
| Boise: | 24.6 |
| Eagle: | 41.0 |
| Meridian: | 25.0 |
| Star: | 64.4 |
| Kuna: | 53.9 |
| Nampa: | 29.8 |
| Middleton: | 77.9 |
| Emmett: | 182.4 |
 The median response time based on all reported fire incidents is 5 minutes. This is lower than the state median value.
The median response time in Garden City, ID compared to nearest cities:
(Note: Based on data for all years, including only cities with at least 500 fire incidents)
| Garden City: | 5 minutes |
| Boise: | 5 minutes |
| Eagle: | 7 minutes |
| Meridian: | 6 minutes |
| Star: | 8 minutes |
| Kuna: | 10 minutes |
| Nampa: | 6 minutes |
| Middleton: | 10 minutes |
| Emmett: | 7 minutes |
 According to the data from the years 2002 - 2018 the average number of fire-related yearly casualties is 1. The highest number of reported casualties - 4 took place in 2016, and the lowest - 0 in 2005. The data has a decreasing trend.
The average number of casualties per 1,000 fires is 17. This indicator was the highest - 118 in 2016, and the lowest 0 in 2005. The trend for injuries per 1,000 incidents is decreasing. Compared to the state value the number of injuries per 1,000 fire incidents is higher.
According to the data from the years 2002 - 2018 the average number of fire-related yearly casualties is 1. The highest number of reported casualties - 4 took place in 2016, and the lowest - 0 in 2005. The data has a decreasing trend.
The average number of casualties per 1,000 fires is 17. This indicator was the highest - 118 in 2016, and the lowest 0 in 2005. The trend for injuries per 1,000 incidents is decreasing. Compared to the state value the number of injuries per 1,000 fire incidents is higher.
 28.8% incidents where reported in the morning and 71.2% in the evening. The most fires (16.0%) took place on Monday, and the least (12.2%) on Wednesday.
 According to the 940 incident reports from years 2002 - 2018 most fires (14.5%) took place during July, and the least (4.3%) in January.
 Out of all 8,373 cases reported during the years 2002 - 2018, the most belonged to the categories: Rescue & EMS (50.2%), Good Intent Call (14.7%), and Fire (11.2%).
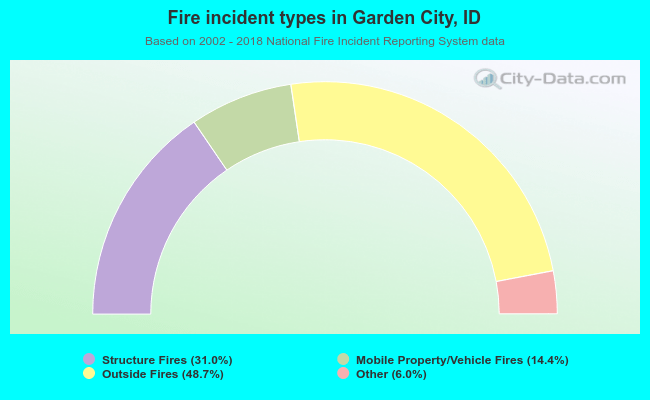 When looking into fire subcategories, the most incidents belonged to: Outside Fires (48.7%), and Structure Fires (31.0%).