Gary: Fire Incidents, Indiana (IN)
Where are fire incidents reported in Gary, IN
Something went wrong! Please refresh the page.
| Fire incidents reported | |
|---|---|
| Sreet name | Count |
| 5TH AVE | 154 |
| BROADWAY | 152 |
| RIDGE RD | 144 |
| GRANT ST | 134 |
| CLARK RD | 114 |
| BROADWAY ST | 112 |
| CONNECTICUT ST | 112 |
| MASSACHUSETTS ST | 104 |
| WASHINGTON ST | 104 |
| DELAWARE ST | 102 |
| HARRISON ST | 102 |
| MADISON ST | 102 |
| JACKSON ST | 96 |
| JEFFERSON ST | 92 |
| MARYLAND ST | 90 |
| PENNSYLVANIA ST | 90 |
| BURR ST | 86 |
| POLK ST | 86 |
| CHASE ST | 84 |
| BUCHANAN ST | 82 |
| 41ST AVE | 80 |
| GEORGIA ST | 80 |
| VIRGINIA ST | 80 |
| 25TH AVE | 78 |
| COLFAX ST | 78 |
| TYLER ST | 76 |
| CALHOUN ST | 74 |
| CLINE AVE | 74 |
| MONROE ST | 74 |
| MELTON RD | 72 |
| Other | 3,793 |
2002 - 2017 National Fire Incident Reporting System (NFIRS) incidents
- Incident types reported to NFIRS in Gary, IN
- 6,70136.9%Fire
- 4,44824.5%Hazardous Condition
- 2,40113.2%Rescue & EMS
- 1,98110.9%Service Call
- 1,7919.9%False Alarm
- 6813.8%Good Intent Call
- 1280.7%Special Incident
- Fire incident types reported to NFIRS in Gary, IN
- 3,49752.2%Outside Fires
- 1,61024.0%Structure Fires
- 96714.4%Mobile Property/Vehicle Fires
- 6279.4%Other
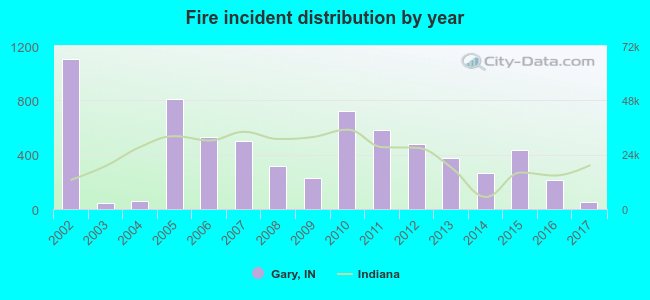 According to the data from the years 2002 - 2017 the average number of fire incidents per year is 419. The highest number of fire incidents - 1,101 took place in 2002, and the least - 45 in 2003. The data has a decreasing trend.
The average number of yearly fire incidents per 10k residents in Gary, IN compared to nearest cities:
(Note: Based on data for the last 3 years, including only cities with population 5,000 and above)
| Gary: | 11.3 |
| Lake Station: | 22.2 |
| Griffith: | 3.6 |
| Hobart: | 1.4 |
| Highland: | 16.3 |
| Merrillville: | 23.5 |
| East Chicago: | 61.9 |
| Hammond: | 0.1 |
| Schererville: | 13.3 |
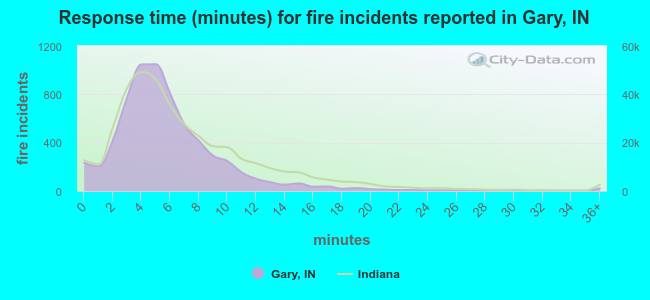 The median response time based on all reported fire incidents is 5 minutes. This is lower compared to the state median value.
The median response time in Gary, IN compared to nearest cities:
(Note: Based on data for all years, including only cities with at least 500 fire incidents)
| Gary: | 5 minutes |
| Lake Station: | 7 minutes |
| Hobart: | 5 minutes |
| Highland: | 7 minutes |
| Merrillville: | 5 minutes |
| East Chicago: | 3 minutes |
| Hammond: | 4 minutes |
| Schererville: | 7 minutes |
| Portage: | 6 minutes |
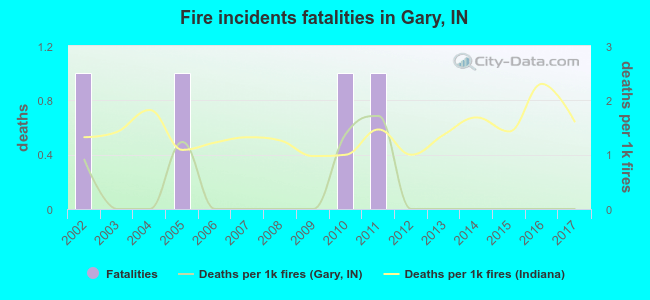 According to the data from the years 2002 - 2017 the average number of fire-related yearly deaths is 0. The highest number of reported deaths - 1 took place in 2002, and the lowest - 0 in 2003. The data has a dropping trend.
The average number of fatalities per 1,000 fires is 0. This indicator was the highest - 2 in 2011, and the lowest 0 in 2003. The trend for fatalities per 1,000 incidents is decreasing. Compared to the state value the number of deaths per 1,000 fire incidents is much lower.
According to the data from the years 2002 - 2017 the average number of fire-related yearly deaths is 0. The highest number of reported deaths - 1 took place in 2002, and the lowest - 0 in 2003. The data has a dropping trend.
The average number of fatalities per 1,000 fires is 0. This indicator was the highest - 2 in 2011, and the lowest 0 in 2003. The trend for fatalities per 1,000 incidents is decreasing. Compared to the state value the number of deaths per 1,000 fire incidents is much lower.Deaths per 1,000 incidents in Gary, IN compared to nearest cities:
(Note: Based on data for all years, including only cities with at least 2,500 fire incidents)
| Gary: | 0.6 |
| Hammond: | 1.4 |
| Calumet City: | 2.5 |
| Dolton: | 0.6 |
| Riverdale: | 1.2 |
| Harvey: | 2.8 |
| Valparaiso: | 1.4 |
| Oak Lawn: | 3.9 |
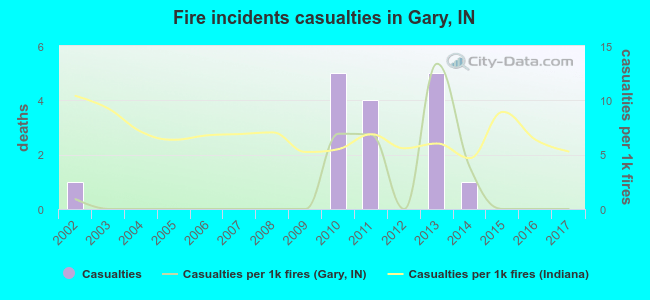 Based on the data from the years 2002 - 2017 the average number of fire-related casualties per year is 1. The highest number of casualties - 5 took place in 2010, and the lowest - 0 in 2003. The data has a decreasing trend.
The average number of injuries per 1,000 fires is 2. This indicator was the highest - 13 in 2013, and the lowest 0 in 2003. The trend for injuries per 1,000 fires is decreasing. Compared to the state value the number of casualties per 1,000 fire incidents is much lower.
Based on the data from the years 2002 - 2017 the average number of fire-related casualties per year is 1. The highest number of casualties - 5 took place in 2010, and the lowest - 0 in 2003. The data has a decreasing trend.
The average number of injuries per 1,000 fires is 2. This indicator was the highest - 13 in 2013, and the lowest 0 in 2003. The trend for injuries per 1,000 fires is decreasing. Compared to the state value the number of casualties per 1,000 fire incidents is much lower.Casualties per 1,000 incidents in Gary, IN compared to nearest cities:
(Note: Based on data for all years, including only cities with at least 500 fire incidents)
| Gary: | 2.4 |
| Lake Station: | 1.9 |
| Hobart: | 16.3 |
| Highland: | 4.2 |
| Merrillville: | 6.6 |
| East Chicago: | 9.1 |
| Hammond: | 0.7 |
| Schererville: | 3.9 |
| Portage: | 12.3 |
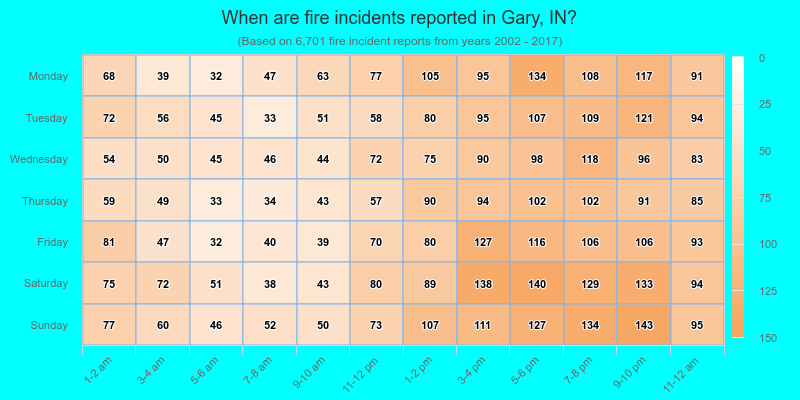
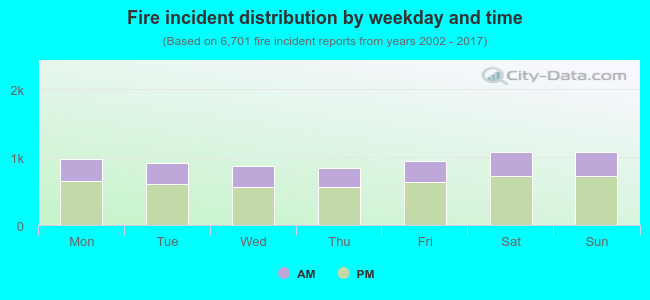 33.6% incidents where reported in the morning and 66.4% in the evening. The most fires (16.1%) took place on Saturday, and the least (12.5%) on Thursday.
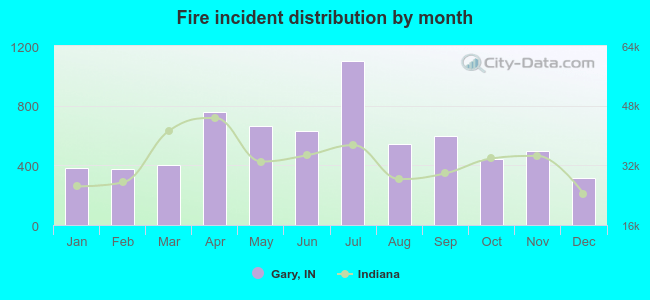 Based on the 6,701 incident reports from years 2002 - 2017 most fires (16.4%) took place during July, and the least (4.7%) in December.
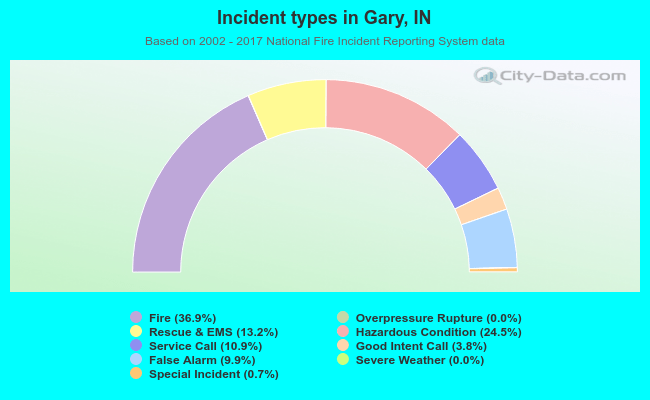 Out of all 18,142 cases reported during the years 2002 - 2017, the most belonged to the categories: Fire (36.9%), Hazardous Condition (24.5%), and Rescue & EMS (13.2%).
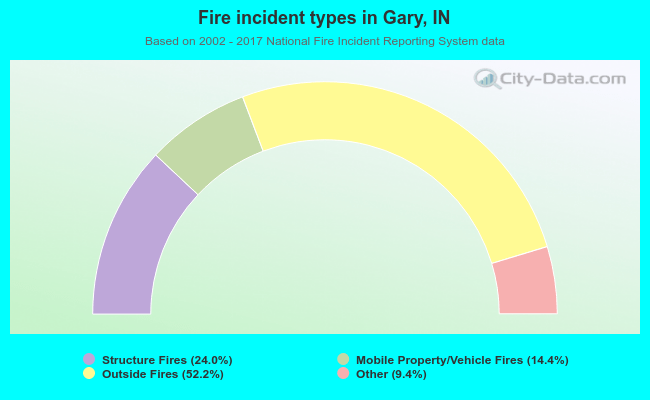 When looking into fire subcategories, the most incidents belonged to: Outside Fires (52.2%), and Structure Fires (24.0%).