Glendale Heights: Fire Incidents, Illinois (IL)
Where are fire incidents reported in Glendale Heights, IL
Something went wrong! Please refresh the page.
| Fire incidents reported | |
|---|---|
| Sreet name | Count |
| BLOOMINGDALE RD | 160 |
| NORTH AVE | 160 |
| GREGORY AVENUE | 90 |
| GREGORY AVE | 84 |
| GLEN ELLYN RD | 56 |
| FULLERTON AVE | 52 |
| MARILYN AVE | 50 |
| GLADSTONE DR | 48 |
| ARMY TRAIL RD | 40 |
| SHOREWOOD DR | 40 |
| GLEN HILL DR | 38 |
| JAMES CT | 38 |
| SOMERSET DRIVE | 36 |
| WINDY POINT DR | 34 |
| BLOOMINGDALE ROAD | 32 |
| CEDAR ST | 32 |
| PRESIDENT ST | 32 |
| GLADSTONE DRIVE | 30 |
| MEDINAH CIR | 30 |
| MICHAEL CT | 30 |
| WRIGHTWOOD AVE | 30 |
| JONES ST | 28 |
| WINTHROP AVE | 28 |
| MITCHELL RD | 26 |
| SPRUCE ST | 26 |
| BRIAN DR | 24 |
| LAKE DR | 24 |
| REGENCY DR | 24 |
| LINCOLN AVE | 22 |
| PRAIRIE AVE | 22 |
| Other | 372 |
2002 - 2018 National Fire Incident Reporting System (NFIRS) incidents
- Incident types reported to NFIRS in Glendale Heights, IL
- 9,96651.7%Rescue & EMS
- 3,31017.2%False Alarm
- 2,28511.9%Hazardous Condition
- 1,7389.0%Fire
- 1,2176.3%Service Call
- 7243.8%Good Intent Call
- Fire incident types reported to NFIRS in Glendale Heights, IL
- 1,02559.0%Structure Fires
- 44525.6%Outside Fires
- 1669.6%Mobile Property/Vehicle Fires
- 1025.9%Other
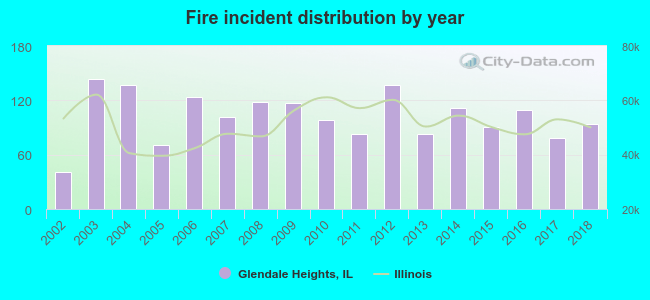 Based on the data from the years 2002 - 2018 the average number of fires per year is 102. The highest number of fires - 144 took place in 2003, and the least - 41 in 2002. The data has a growing trend.
The average number of yearly fire incidents per 10k residents in Glendale Heights, IL compared to nearest cities:
(Note: Based on data for the last 3 years, including only cities with population 5,000 and above)
| Glendale Heights: | 27.1 |
| Bloomingdale: | 34.5 |
| Carol Stream: | 21.1 |
| Glen Ellyn: | 26.9 |
| Addison: | 33.4 |
| Roselle: | 37.8 |
| Wheaton: | 18.3 |
| Lombard: | 27.0 |
| Itasca: | 53.8 |
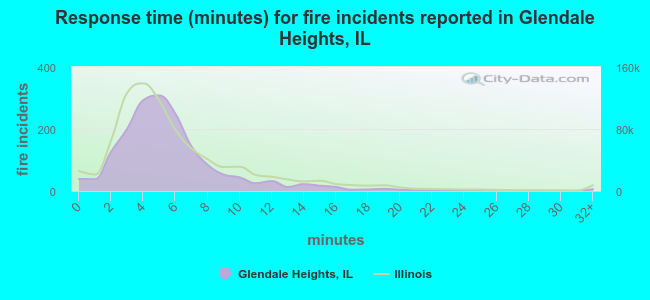 The median response time based on all reported fire incidents is 5 minutes. This is about the same as the state median value.
The median response time in Glendale Heights, IL compared to nearest cities:
(Note: Based on data for all years, including only cities with at least 500 fire incidents)
| Glendale Heights: | 5 minutes |
| Bloomingdale: | 5 minutes |
| Carol Stream: | 5 minutes |
| Glen Ellyn: | 6 minutes |
| Addison: | 5 minutes |
| Roselle: | 6 minutes |
| Wheaton: | 5 minutes |
| Lombard: | 5 minutes |
| Itasca: | 6 minutes |
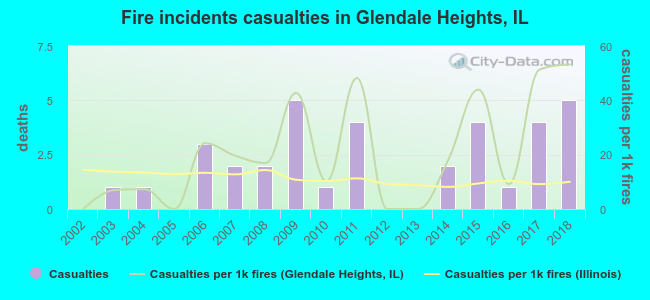 According to the data from the years 2002 - 2018 the average number of fire-related yearly casualties is 2. The highest number of reported casualties - 5 took place in 2009, and the lowest - 0 in 2002. The data has an increasing trend.
The average number of casualties per 1,000 fire incidents is 21. This indicator was the highest - 53 in 2018, and the lowest 0 in 2002. The trend for casualties per 1,000 fires is increasing. Compared to the state value the number of casualties per 1,000 fire incidents is higher.
According to the data from the years 2002 - 2018 the average number of fire-related yearly casualties is 2. The highest number of reported casualties - 5 took place in 2009, and the lowest - 0 in 2002. The data has an increasing trend.
The average number of casualties per 1,000 fire incidents is 21. This indicator was the highest - 53 in 2018, and the lowest 0 in 2002. The trend for casualties per 1,000 fires is increasing. Compared to the state value the number of casualties per 1,000 fire incidents is higher.Casualties per 1,000 incidents in Glendale Heights, IL compared to nearest cities:
(Note: Based on data for all years, including only cities with at least 500 fire incidents)
| Glendale Heights: | 20.1 |
| Bloomingdale: | 12.1 |
| Carol Stream: | 7.4 |
| Glen Ellyn: | 12.2 |
| Addison: | 15.0 |
| Roselle: | 12.6 |
| Wheaton: | 12.6 |
| Lombard: | 13.3 |
| Itasca: | 13.4 |
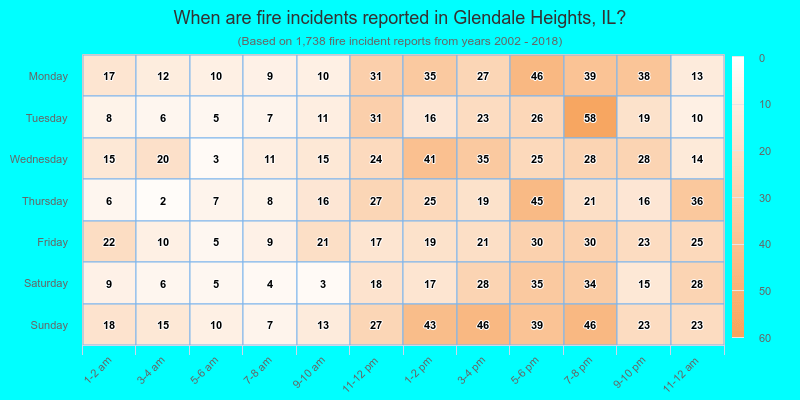
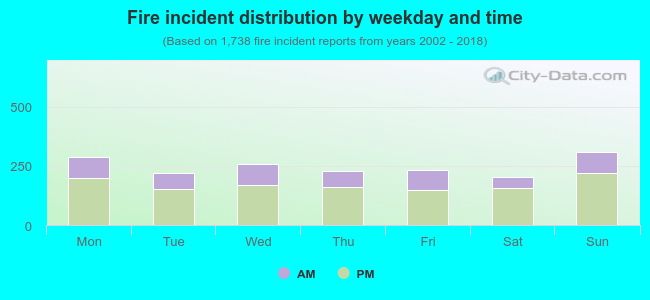 30.5% incidents where reported in the morning and 69.5% in the evening. The most fires (17.8%) took place on Sunday, and the least (11.6%) on Saturday.
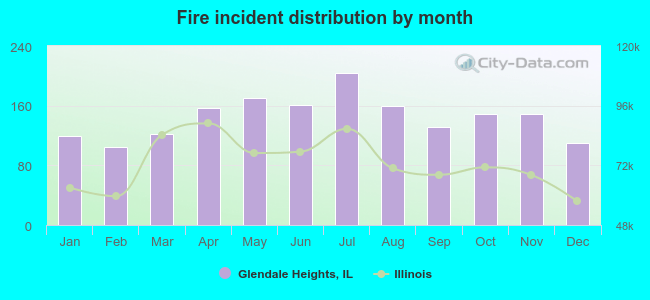 According to the 1,738 fires from years 2002 - 2018 most fires (11.7%) took place during July, and the least (6.0%) in February.
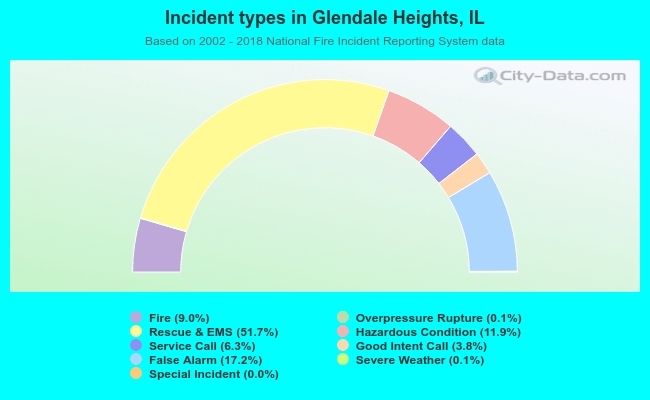 Out of all 19,276 cases reported during the years 2002 - 2018, the most belonged to the categories: Rescue & EMS (51.7%), False Alarm (17.2%), and Hazardous Condition (11.9%).
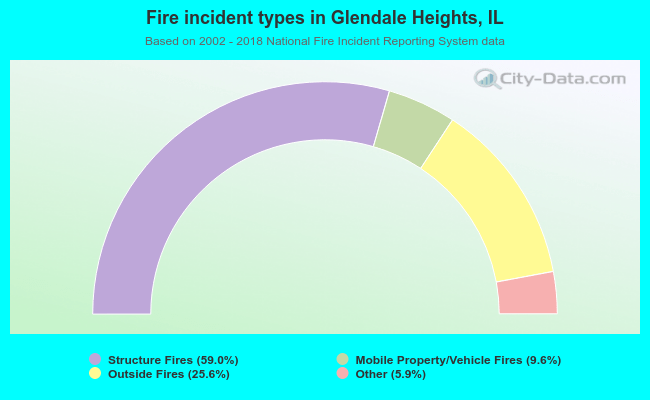 When looking into fire subcategories, the most reports belonged to: Structure Fires (59.0%), and Outside Fires (25.6%).