Glenside: Fire Incidents, Pennsylvania (PA)
Where are fire incidents reported in Glenside, PA
Something went wrong! Please refresh the page.
|
| |||||||||||||||||||||||||||||||||||||||||||||||||||||||||||||||||||||||||||||||||||||||||||||||||||||||||||||
2004 - 2018 National Fire Incident Reporting System (NFIRS) incidents
- Incident types reported to NFIRS in Glenside, PA
- 35731.9%False Alarm
- 32729.2%Fire
- 26323.5%Hazardous Condition
- 837.4%Good Intent Call
- 464.1%Service Call
- 363.2%Rescue & EMS
- 40.4%Overpressure Rupture
- Fire incident types reported to NFIRS in Glenside, PA
- 22067.3%Structure Fires
- 6519.9%Outside Fires
- 3510.7%Mobile Property/Vehicle Fires
- 72.1%Other
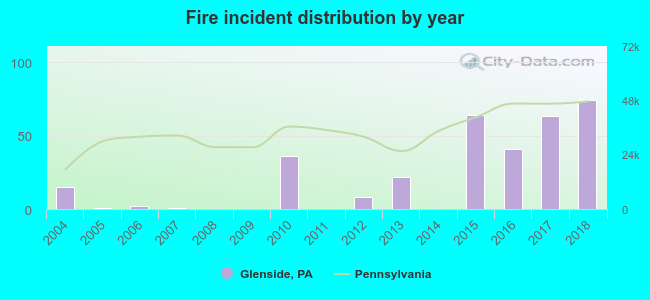 According to the data from the years 2004 - 2018 the average number of fires per year is 22. The highest number of fires - 74 took place in 2018, and the least - 0 in 2008. The data has a rising trend.
The average number of yearly fire incidents per 10k residents in Glenside, PA compared to nearest cities:
(Note: Based on data for the last 3 years, including only cities with population 5,000 and above)
| Glenside: | 70.8 |
| Oreland: | 24.7 |
| Wyndmoor: | 41.2 |
| Fort Washington: | 36.1 |
| Willow Grove: | 12.9 |
| Ambler: | 37.4 |
| Maple Glen: | 3.0 |
| Horsham: | 23.8 |
| Hatboro: | 25.1 |
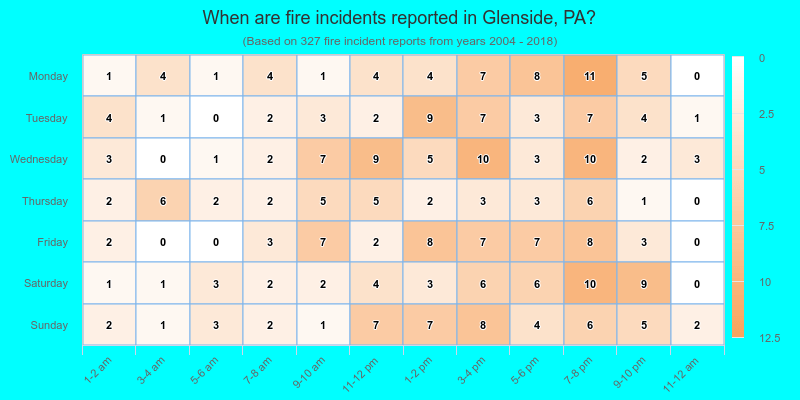
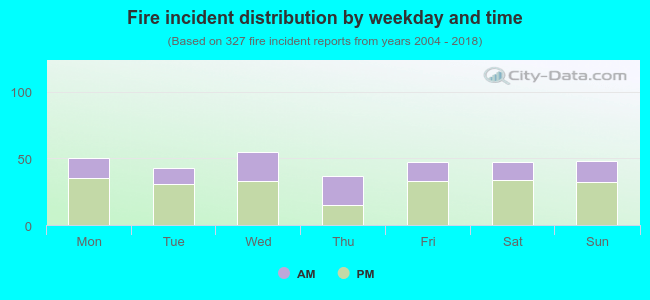 34.9% incidents where reported in the morning and 65.1% in the evening. The most fires (16.8%) took place on Wednesday, and the least (11.3%) on Thursday.
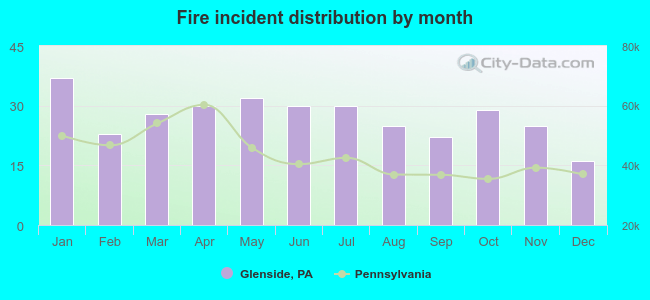 Based on the 327 fire incidents from years 2004 - 2018 most fires (11.3%) took place during January, and the least (4.9%) in December.
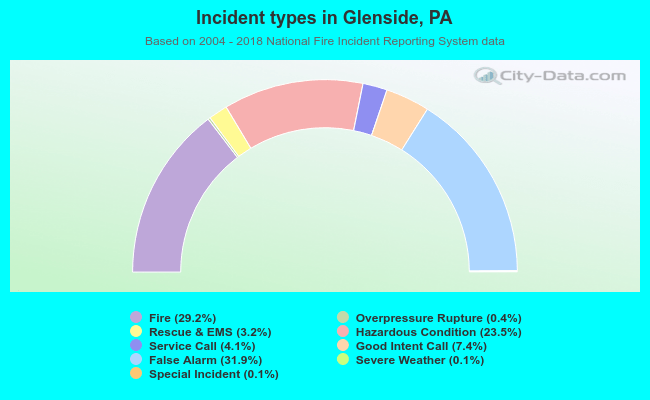 Out of all 1,118 cases reported during the years 2004 - 2018, the most belonged to the categories: False Alarm (31.9%), Fire (29.2%), and Hazardous Condition (23.5%).
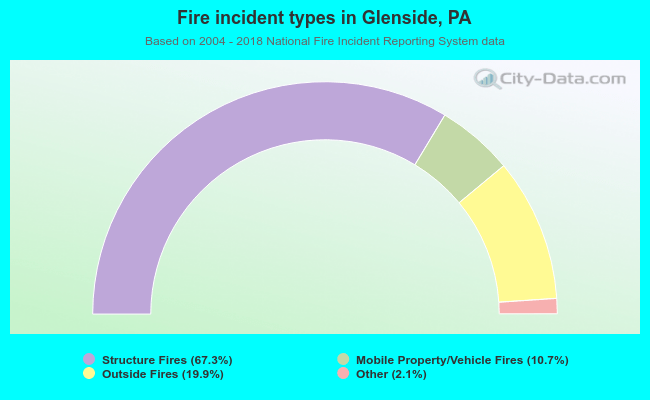 When looking into fire subcategories, the most incidents belonged to: Structure Fires (67.3%), and Outside Fires (19.9%).