Gresham: Fire Incidents, Oregon (OR)
Where are fire incidents reported in Gresham, OR
Something went wrong! Please refresh the page.
| Fire incidents reported | |
|---|---|
| Sreet name | Count |
| POWELL BLVD | 376 |
| STARK ST | 372 |
| DIVISION ST | 370 |
| BURNSIDE RD | 358 |
| BURNSIDE ST | 202 |
| 181ST AVE | 190 |
| KANE DR | 106 |
| HOGAN DR | 104 |
| HOGAN RD | 104 |
| MAIN AVE | 104 |
| 182ND AVE | 102 |
| HALSEY ST | 98 |
| HIGHLAND DR | 76 |
| GLISAN ST | 74 |
| ORIENT DR | 74 |
| 8TH ST | 70 |
| PALMQUIST RD | 68 |
| 162ND AVE | 66 |
| EASTMAN | 66 |
| YAMHILL ST | 66 |
| CLEVELAND AVE | 64 |
| SANDY BLVD | 60 |
| 182 AVE | 56 |
| 5TH ST | 56 |
| EASTMAN PKWY | 54 |
| 190TH AVE | 52 |
| POWELL BV | 50 |
| POWELL VALLEY RD | 48 |
| 172ND AVE | 44 |
| 181 AVE | 44 |
| Other | 769 |
2002 - 2018 National Fire Incident Reporting System (NFIRS) incidents
- Incident types reported to NFIRS in Gresham, OR
- 24,17863.1%Rescue & EMS
- 4,34311.3%Fire
- 3,2548.5%Good Intent Call
- 3,0998.1%Service Call
- 2,0685.4%False Alarm
- 1,3403.5%Hazardous Condition
- Fire incident types reported to NFIRS in Gresham, OR
- 2,26052.0%Outside Fires
- 1,16026.7%Structure Fires
- 60614.0%Mobile Property/Vehicle Fires
- 3177.3%Other
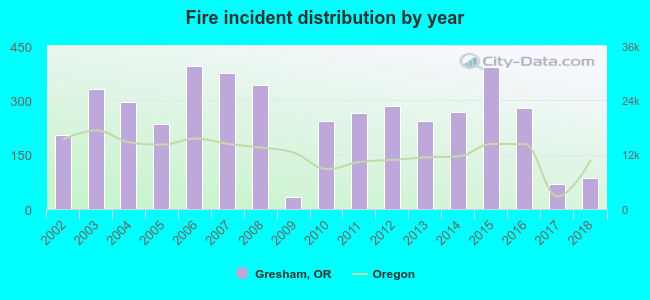 Based on the data from the years 2002 - 2018 the average number of fires per year is 255. The highest number of fire incidents - 394 took place in 2006, and the least - 34 in 2009. The data has a declining trend.
The average number of yearly fire incidents per 10k residents in Gresham, OR compared to nearest cities:
(Note: Based on data for the last 3 years, including only cities with population 5,000 and above)
| Gresham: | 13.1 |
| Fairview: | 14.1 |
| Troutdale: | 9.9 |
| Damascus: | 13.8 |
| Happy Valley: | 20.6 |
| Clackamas: | 79.2 |
| Milwaukie: | 31.5 |
| Portland: | 17.5 |
| Gladstone: | 27.8 |
 The median response time based on all reported fire incidents is 5 minutes. This is lower than the state median value.
The median response time in Gresham, OR compared to nearest cities:
(Note: Based on data for all years, including only cities with at least 500 fire incidents)
| Gresham: | 5 minutes |
| Troutdale: | 5 minutes |
| Happy Valley: | 5 minutes |
| Clackamas: | 6 minutes |
| Milwaukie: | 5 minutes |
| Portland: | 5 minutes |
| Gladstone: | 5 minutes |
| Sandy: | 8 minutes |
| Oregon City: | 6 minutes |
 Based on the reports from the years 2002 - 2018 the average number of fire-related yearly deaths is 0. The highest number of reported deaths - 2 took place in 2007, and the lowest - 0 in 2002. The data has a constant trend.
The average number of deaths per 1,000 fires is 1. This indicator was the highest - 5 in 2007, and the lowest 0 in 2002. The trend for fatalities per 1,000 fire incidents is constant. Compared to the state value the number of deaths per 1,000 incidents is much lower.
Based on the reports from the years 2002 - 2018 the average number of fire-related yearly deaths is 0. The highest number of reported deaths - 2 took place in 2007, and the lowest - 0 in 2002. The data has a constant trend.
The average number of deaths per 1,000 fires is 1. This indicator was the highest - 5 in 2007, and the lowest 0 in 2002. The trend for fatalities per 1,000 fire incidents is constant. Compared to the state value the number of deaths per 1,000 incidents is much lower.
 According to the reports from the years 2002 - 2018 the average number of fire-related yearly casualties is 3. The highest number of injuries - 6 took place in 2012, and the lowest - 0 in 2002. The data has a constant trend.
The average number of injuries per 1,000 fire incidents is 11. This indicator was the highest - 22 in 2016, and the lowest 0 in 2002. The trend for injuries per 1,000 fire incidents is constant. Compared to the Oregon value the number of injuries per 1,000 incidents is about the same.
According to the reports from the years 2002 - 2018 the average number of fire-related yearly casualties is 3. The highest number of injuries - 6 took place in 2012, and the lowest - 0 in 2002. The data has a constant trend.
The average number of injuries per 1,000 fire incidents is 11. This indicator was the highest - 22 in 2016, and the lowest 0 in 2002. The trend for injuries per 1,000 fire incidents is constant. Compared to the Oregon value the number of injuries per 1,000 incidents is about the same.Casualties per 1,000 incidents in Gresham, OR compared to nearest cities:
(Note: Based on data for all years, including only cities with at least 500 fire incidents)
| Gresham: | 11.5 |
| Troutdale: | 18.6 |
| Happy Valley: | 7.5 |
| Clackamas: | 14.0 |
| Milwaukie: | 24.0 |
| Portland: | 15.9 |
| Gladstone: | 5.0 |
| Sandy: | 15.9 |
| Oregon City: | 9.7 |
 36.2% incidents where reported in the morning and 63.8% in the evening. The most fires (16.0%) took place on Saturday, and the least (12.4%) on Wednesday.
 Based on the 4,343 fire incident reports from years 2002 - 2018 most fires (17.5%) took place during July, and the least (4.8%) in December.
 Out of all 38,329 cases reported during the years 2002 - 2018, the most belonged to the categories: Rescue & EMS (63.1%), Fire (11.3%), and Good Intent Call (8.5%).
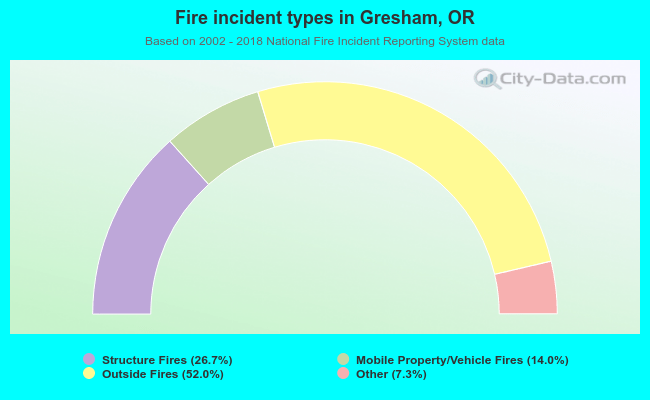 When looking into fire subcategories, the most reports belonged to: Outside Fires (52.0%), and Structure Fires (26.7%).