Haverhill: Fire Incidents, Massachusetts (MA)
Where are fire incidents reported in Haverhill, MA
Something went wrong! Please refresh the page.
| Fire incidents reported | |
|---|---|
| Sreet name | Count |
| WASHINGTON ST | 168 |
| MAIN ST | 140 |
| MAIN ST | 130 |
| RIVER ST | 110 |
| WASHINGTON ST | 102 |
| WATER ST | 100 |
| WINTER ST | 100 |
| BEACON ST | 98 |
| LOWELL AVE | 88 |
| RIVER ST | 88 |
| BROADWA X | 84 |
| LOWELL AV | 80 |
| WOODCOCK AV | 80 |
| WATER ST | 70 |
| VICTOR ST | 66 |
| HILLDALE AV | 64 |
| PORTLAND ST | 58 |
| EMERSON ST | 52 |
| BROADWAY | 50 |
| BUTTONWOODS AV | 50 |
| NORTH AV | 50 |
| PRIMROSE ST | 50 |
| SUMMER ST | 50 |
| HILLDALE AVE | 48 |
| KIMBALL ST | 48 |
| SOUTH MAIN ST | 48 |
| WELCOME ST | 46 |
| 495N | 44 |
| 495S | 44 |
| CEDAR ST | 44 |
| Other | 1,803 |
2002 - 2018 National Fire Incident Reporting System (NFIRS) incidents
- Incident types reported to NFIRS in Haverhill, MA
- 17,21849.7%Rescue & EMS
- 4,93114.2%False Alarm
- 4,05311.7%Fire
- 3,80411.0%Service Call
- 2,4297.0%Good Intent Call
- 2,1376.2%Hazardous Condition
- 390.1%Special Incident
- Fire incident types reported to NFIRS in Haverhill, MA
- 2,22054.8%Structure Fires
- 1,30832.3%Outside Fires
- 3879.5%Mobile Property/Vehicle Fires
- 1383.4%Other
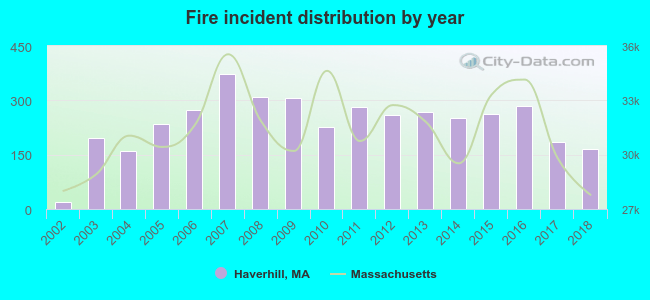 According to the data from the years 2002 - 2018 the average number of fires per year is 238. The highest number of fires - 374 took place in 2007, and the least - 18 in 2002. The data has a growing trend.
The average number of yearly fire incidents per 10k residents in Haverhill, MA compared to nearest cities:
(Note: Based on data for the last 3 years, including only cities with population 5,000 and above)
| Haverhill: | 33.9 |
| Groveland: | 32.5 |
| Merrimac: | 68.9 |
| Methuen: | 26.7 |
| Georgetown: | 55.4 |
| Lawrence: | 26.0 |
| North Andover: | 38.9 |
| Andover: | 113.4 |
| Amesbury: | 35.3 |
 The median response time based on all reported fire incidents is 4 minutes. This is similar to the state median value.
The median response time in Haverhill, MA compared to nearest cities:
(Note: Based on data for all years, including only cities with at least 500 fire incidents)
| Haverhill: | 4 minutes |
| Merrimac: | 5 minutes |
| Methuen: | 4 minutes |
| Georgetown: | 5 minutes |
| Lawrence: | 3 minutes |
| North Andover: | 4 minutes |
| Boxford: | 8 minutes |
| Andover: | 6 minutes |
| Amesbury: | 5 minutes |
 According to the reports from the years 2002 - 2018 the average number of fire-related fatalities per year is 0. The highest number of deaths - 2 took place in 2008, and the lowest - 0 in 2002. The data has a constant trend.
The average number of fatalities per 1,000 fires is 2. This indicator was the highest - 6 in 2008, and the lowest 0 in 2002. The trend for fatalities per 1,000 incidents is constant. Compared to the state value the number of fatalities per 1,000 incidents is similar.
According to the reports from the years 2002 - 2018 the average number of fire-related fatalities per year is 0. The highest number of deaths - 2 took place in 2008, and the lowest - 0 in 2002. The data has a constant trend.
The average number of fatalities per 1,000 fires is 2. This indicator was the highest - 6 in 2008, and the lowest 0 in 2002. The trend for fatalities per 1,000 incidents is constant. Compared to the state value the number of fatalities per 1,000 incidents is similar.
 According to the reports from the years 2002 - 2018 the average number of fire-related casualties per year is 2. The highest number of reported casualties - 12 took place in 2014, and the lowest - 0 in 2003. The data has a constant trend.
The average number of injuries per 1,000 fires is 12. This indicator was the highest - 56 in 2002, and the lowest 0 in 2003. The trend for injuries per 1,000 fire incidents is declining. Compared to the state value the number of casualties per 1,000 incidents is about the same.
According to the reports from the years 2002 - 2018 the average number of fire-related casualties per year is 2. The highest number of reported casualties - 12 took place in 2014, and the lowest - 0 in 2003. The data has a constant trend.
The average number of injuries per 1,000 fires is 12. This indicator was the highest - 56 in 2002, and the lowest 0 in 2003. The trend for injuries per 1,000 fire incidents is declining. Compared to the state value the number of casualties per 1,000 incidents is about the same.Casualties per 1,000 incidents in Haverhill, MA compared to nearest cities:
(Note: Based on data for all years, including only cities with at least 500 fire incidents)
| Haverhill: | 9.9 |
| Merrimac: | 0.0 |
| Methuen: | 5.0 |
| Georgetown: | 11.3 |
| Lawrence: | 9.8 |
| North Andover: | 5.9 |
| Boxford: | 5.3 |
| Andover: | 1.0 |
| Amesbury: | 15.5 |
 28.8% incidents where reported in the morning and 71.2% in the evening. The most fires (16.5%) took place on Sunday, and the least (12.9%) on Tuesday.
 Based on the 4,053 reports from years 2002 - 2018 most fires (12.1%) took place during April, and the least (6.2%) in February.
 Out of all 34,646 cases reported during the years 2002 - 2018, the most belonged to the categories: Rescue & EMS (49.7%), False Alarm (14.2%), and Fire (11.7%).
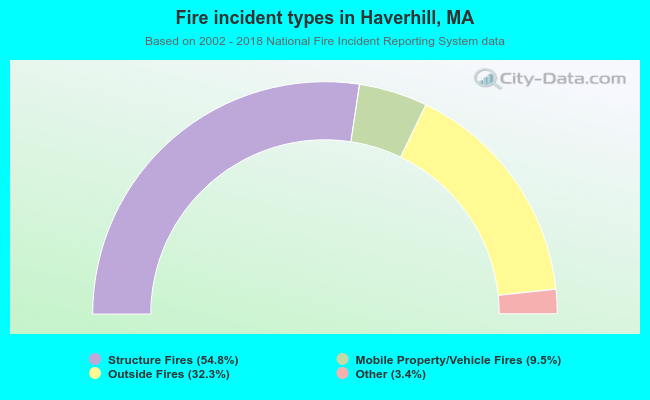 When looking into fire subcategories, the most incidents belonged to: Structure Fires (54.8%), and Outside Fires (32.3%).