Hawley: Fire Incidents, Pennsylvania (PA)
Where are fire incidents reported in Hawley, PA
Something went wrong! Please refresh the page.
|
| |||||||||||||||||||||||||||||||||||||||||||||||||||||||||||||||||||||||||||||||||||||||||||||||||||||||||||||
2003 - 2018 National Fire Incident Reporting System (NFIRS) incidents
- Incident types reported to NFIRS in Hawley, PA
- 68744.2%Hazardous Condition
- 24816.0%Fire
- 16510.6%False Alarm
- 16410.6%Rescue & EMS
- 1429.1%Service Call
- 1348.6%Good Intent Call
- 70.5%Severe Weather
- 30.2%Overpressure Rupture
- 30.2%Special Incident
- Fire incident types reported to NFIRS in Hawley, PA
- 13956.0%Structure Fires
- 7329.4%Outside Fires
- 2610.5%Mobile Property/Vehicle Fires
- 104.0%Other
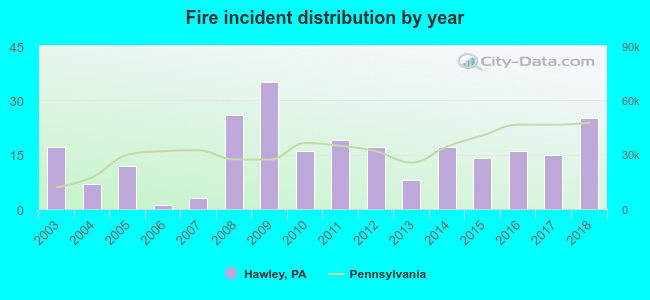 Based on the data from the years 2003 - 2018 the average number of fires per year is 16. The highest number of fire incidents - 35 took place in 2009, and the least - 1 in 2006. The data has a growing trend.
 According to the data from the years 2003 - 2018 the average number of fire-related casualties per year is 0. The highest number of reported casualties - 2 took place in 2004, and the lowest - 0 in 2003. The data has a rising trend.
 31.9% incidents where reported in the morning and 68.1% in the evening. The most fires (17.3%) took place on Saturday, and the least (10.9%) on Thursday.
 Based on the 248 incident reports from years 2003 - 2018 most fires (18.1%) took place during April, and the least (1.2%) in June.
 Out of all 1,553 cases reported during the years 2003 - 2018, the most belonged to the categories: Hazardous Condition (44.2%), Fire (16.0%), and False Alarm (10.6%).
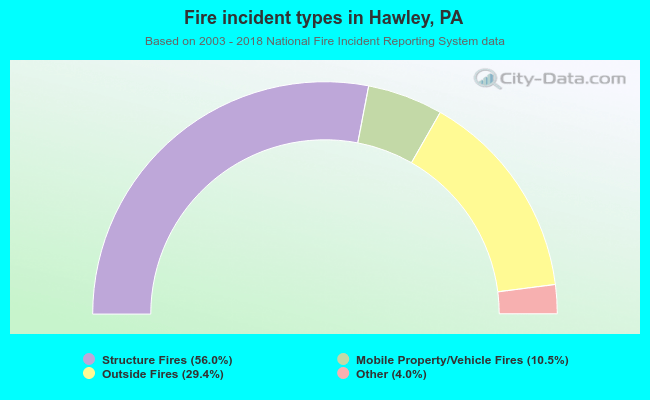 When looking into fire subcategories, the most incidents belonged to: Structure Fires (56.0%), and Outside Fires (29.4%).