Heath: Fire Incidents, Texas (TX)
Where are fire incidents reported in Heath, TX
Something went wrong! Please refresh the page.
|
| |||||||||||||||||||||||||||||||||||||||||||||||||||||||||||||||||||||||||||||||||||||||||||||||||||||||||||||
2004 - 2018 National Fire Incident Reporting System (NFIRS) incidents
- Incident types reported to NFIRS in Heath, TX
- 70450.1%Rescue & EMS
- 19814.1%Good Intent Call
- 15811.2%False Alarm
- 14410.2%Hazardous Condition
- 1309.3%Fire
- 624.4%Service Call
- 50.4%Severe Weather
- 20.1%Overpressure Rupture
- 20.1%Special Incident
- Fire incident types reported to NFIRS in Heath, TX
- 6046.2%Structure Fires
- 5240.0%Outside Fires
- 1310.0%Other
- 53.8%Mobile Property/Vehicle Fires
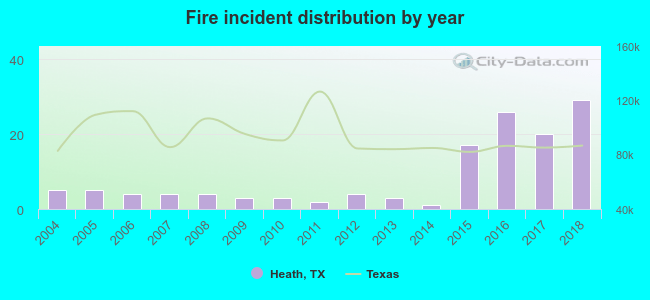 According to the data from the years 2004 - 2018 the average number of fires per year is 9. The highest number of fire incidents - 29 took place in 2018, and the least - 1 in 2014. The data has a rising trend.
The average number of yearly fire incidents per 10k residents in Heath, TX compared to nearest cities:
(Note: Based on data for the last 3 years, including only cities with population 5,000 and above)
| Heath: | 31.3 |
| Rockwall: | 23.0 |
| Rowlett: | 17.9 |
| Sunnyvale: | 56.1 |
| Forney: | 71.1 |
| Fate: | 35.2 |
| Mesquite: | 31.4 |
| Garland: | 25.0 |
| Sachse: | 16.6 |

 19.2% incidents where reported in the morning and 80.8% in the evening. The most fires (16.2%) took place on Friday, and the least (11.5%) on Tuesday.
 According to the 130 fire incident reports from years 2004 - 2018 most fires (13.8%) took place during May, and the least (3.8%) in September.
 Out of all 1,405 cases reported during the years 2004 - 2018, the most belonged to the categories: Rescue & EMS (50.1%), Good Intent Call (14.1%), and False Alarm (11.2%).
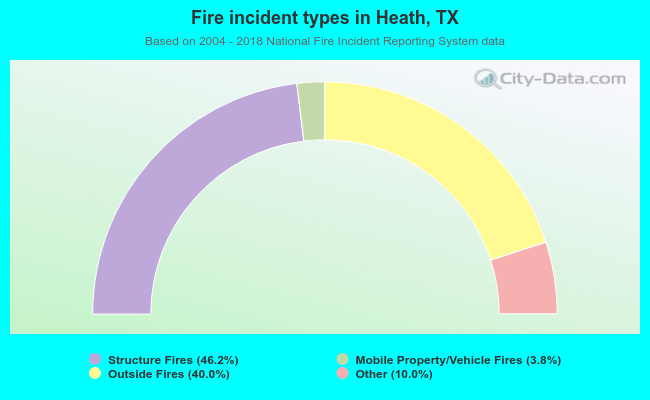 When looking into fire subcategories, the most reports belonged to: Structure Fires (46.2%), and Outside Fires (40.0%).