Hemet: Fire Incidents, California (CA)
Where are fire incidents reported in Hemet, CA
Something went wrong! Please refresh the page.
| Fire incidents reported | |
|---|---|
| Sreet name | Count |
| FLORIDA AVE | 286 |
| STATE ST | 176 |
| FLORIDA AV | 162 |
| GILBERT ST | 92 |
| SAN JACINTO ST | 86 |
| DEVONSHIRE AV | 76 |
| FLORIDA | 68 |
| DEVONSHIRE AVE | 56 |
| STETSON AV | 54 |
| BUENA VISTA ST | 52 |
| KIRBY ST | 52 |
| ACACIA AVE | 48 |
| SANTA FE ST | 48 |
| STETSON AVE | 48 |
| YALE ST | 46 |
| MENLO | 42 |
| SANDERSON AVE | 42 |
| ACACIA AV | 40 |
| ELK ST | 38 |
| HARVARD ST | 38 |
| DEVONSHIRE | 34 |
| MENLO AV | 32 |
| WARREN | 32 |
| GIRARD ST | 30 |
| PALM AVE | 30 |
| ALESSANDRO ST | 28 |
| STATE | 28 |
| COLUMBIA ST | 26 |
| DOMENIGONI | 26 |
| FRUITVALE AV | 26 |
| Other | 248 |
2005 - 2018 National Fire Incident Reporting System (NFIRS) incidents
- Incident types reported to NFIRS in Hemet, CA
- 40,75280.1%Rescue & EMS
- 3,0476.0%Good Intent Call
- 2,9375.8%Service Call
- 2,0904.1%Fire
- 1,0362.0%Hazardous Condition
- 9871.9%False Alarm
- Fire incident types reported to NFIRS in Hemet, CA
- 92444.2%Structure Fires
- 81438.9%Outside Fires
- 29314.0%Mobile Property/Vehicle Fires
- 592.8%Other
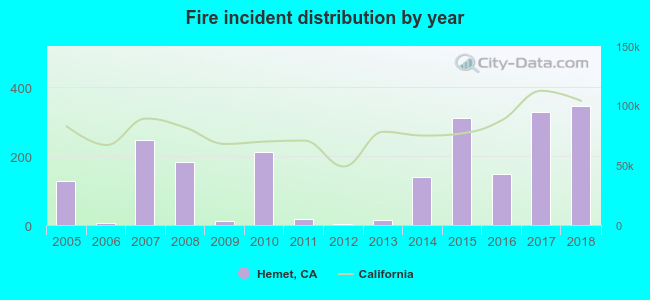 According to the data from the years 2005 - 2018 the average number of fire incidents per year is 149. The highest number of fires - 347 took place in 2018, and the least - 3 in 2012. The data has an increasing trend.
The average number of yearly fire incidents per 10k residents in Hemet, CA compared to nearest cities:
(Note: Based on data for the last 3 years, including only cities with population 5,000 and above)
| Hemet: | 33.0 |
| San Jacinto: | 8.0 |
| Valle Vista: | 1.4 |
| Homeland: | 3.4 |
| Menifee: | 1.0 |
| Nuevo: | 3.9 |
| Beaumont: | 5.4 |
| Sun City: | 0.4 |
| Banning: | 12.8 |
 The median response time based on all reported fire incidents is 6 minutes. This is close to the state median value.
The median response time in Hemet, CA compared to nearest cities:
(Note: Based on data for all years, including only cities with at least 500 fire incidents)
| Hemet: | 6 minutes |
| Redlands: | 6 minutes |
| Loma Linda: | 6 minutes |
| Palm Springs: | 6 minutes |
| Riverside: | 6 minutes |
| Fallbrook: | 10 minutes |
| Colton: | 7 minutes |
| Cathedral City: | 7 minutes |
| San Bernardino: | 7 minutes |
 Based on the data from the years 2005 - 2018 the average number of fire-related fatalities per year is 0. The highest number of reported deaths - 2 took place in 2017, and the lowest - 0 in 2005. The data has a constant trend.
 According to the reports from the years 2005 - 2018 the average number of fire-related yearly casualties is 2. The highest number of casualties - 7 took place in 2015, and the lowest - 0 in 2006. The data has a decreasing trend.
The average number of casualties per 1,000 fire incidents is 9. This indicator was the highest - 47 in 2005, and the lowest 0 in 2006. The trend for casualties per 1,000 fires is declining. Compared to the state value the number of casualties per 1,000 fires is higher.
According to the reports from the years 2005 - 2018 the average number of fire-related yearly casualties is 2. The highest number of casualties - 7 took place in 2015, and the lowest - 0 in 2006. The data has a decreasing trend.
The average number of casualties per 1,000 fire incidents is 9. This indicator was the highest - 47 in 2005, and the lowest 0 in 2006. The trend for casualties per 1,000 fires is declining. Compared to the state value the number of casualties per 1,000 fires is higher.Casualties per 1,000 incidents in Hemet, CA compared to nearest cities:
(Note: Based on data for all years, including only cities with at least 500 fire incidents)
| Hemet: | 11.0 |
| Redlands: | 5.5 |
| Loma Linda: | 5.9 |
| Palm Springs: | 8.7 |
| Riverside: | 23.0 |
| Fallbrook: | 7.3 |
| Colton: | 4.0 |
| Cathedral City: | 12.2 |
| San Bernardino: | 4.3 |
 33.0% incidents where reported in the morning and 67.0% in the evening. The most fires (14.8%) took place on Saturday, and the least (13.0%) on Sunday.
 According to the 2,090 fires from years 2005 - 2018 most fires (10.9%) took place during June, and the least (5.9%) in October.
 Out of all 50,870 cases reported during the years 2005 - 2018, the most belonged to the categories: Rescue & EMS (80.1%), Good Intent Call (6.0%), and Service Call (5.8%).
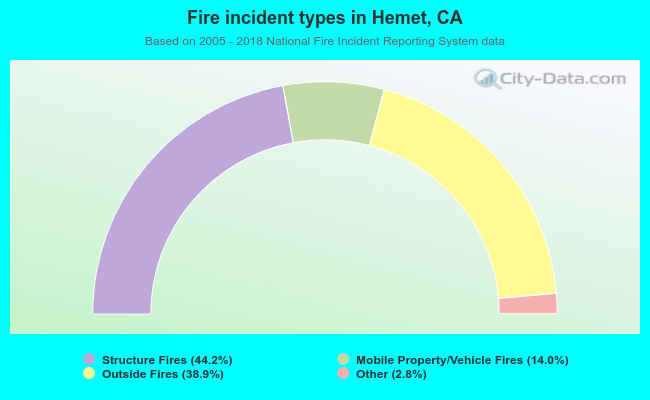 When looking into fire subcategories, the most reports belonged to: Structure Fires (44.2%), and Outside Fires (38.9%).