Hillside: Fire Incidents, New Jersey (NJ)
Where are fire incidents reported in Hillside, NJ
Something went wrong! Please refresh the page.
| Fire incidents reported | |
|---|---|
| Sreet name | Count |
| LIBERTY AVE | 122 |
| HILLSIDE AVE | 70 |
| ROUTE 22 HWY | 64 |
| MAPLE AVE | 48 |
| BROAD ST | 46 |
| LONG AVE | 46 |
| CONANT ST | 38 |
| GARDEN STATE PKY | 38 |
| CENTRAL AVE | 34 |
| HOLLYWOOD AVE | 34 |
| BLOY ST | 30 |
| ROUTE 78 HWY | 30 |
| SALEM AVE | 28 |
| WILLIAMSON AVE | 26 |
| RAMSEY AVE | 22 |
| RYAN ST | 22 |
| WINANS AVE | 20 |
| LESLIE ST | 18 |
| NORTH AVE | 18 |
| UNION AVE | 18 |
| YALE AVE | 18 |
| BUCHANAN ST | 16 |
| FRANKLIN ST | 16 |
| JEROME AVE | 16 |
| EVANS TERMINAL | 14 |
| HIAWATHA AVE | 14 |
| PLYMOUTH RD | 14 |
| TILLMAN ST | 14 |
| BOND ST | 12 |
| CHESTNUT AVE | 12 |
2003 - 2018 National Fire Incident Reporting System (NFIRS) incidents
- Incident types reported to NFIRS in Hillside, NJ
- 8,48054.4%Rescue & EMS
- 2,18514.0%Special Incident
- 2,13013.7%Hazardous Condition
- 9155.9%False Alarm
- 8855.7%Fire
- 6894.4%Service Call
- 2861.8%Good Intent Call
- Fire incident types reported to NFIRS in Hillside, NJ
- 31535.6%Structure Fires
- 25428.7%Outside Fires
- 19121.6%Mobile Property/Vehicle Fires
- 12514.1%Other
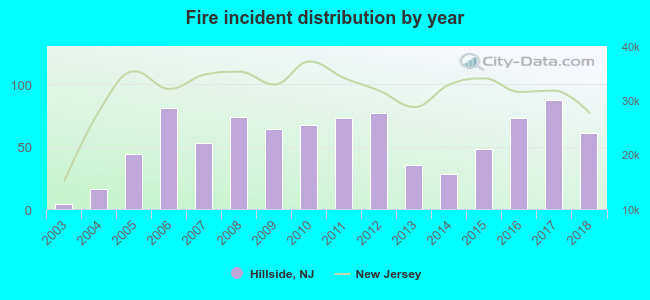 According to the data from the years 2003 - 2018 the average number of fire incidents per year is 55. The highest number of fires - 87 took place in 2017, and the least - 4 in 2003. The data has a growing trend.
The average number of yearly fire incidents per 10k residents in Hillside, NJ compared to nearest cities:
(Note: Based on data for the last 3 years, including only cities with population 5,000 and above)
| Hillside: | 34.1 |
| Irvington: | 26.2 |
| Union: | 27.8 |
| Elizabeth: | 38.7 |
| Roselle Park: | 13.5 |
| Maplewood: | 42.0 |
| Roselle: | 24.1 |
| Kenilworth: | 14.3 |
| Newark: | 41.2 |
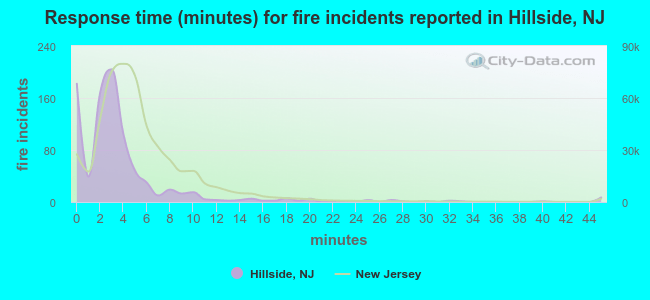 The median response time based on all reported fire incidents is 3 minutes. This is lower compared to the state median value.
The median response time in Hillside, NJ compared to nearest cities:
(Note: Based on data for all years, including only cities with at least 500 fire incidents)
| Hillside: | 3 minutes |
| Irvington: | 3 minutes |
| Union: | 5 minutes |
| Elizabeth: | 3 minutes |
| Maplewood: | 3 minutes |
| Roselle: | 3 minutes |
| Newark: | 3 minutes |
| South Orange: | 3 minutes |
| Linden: | 4 minutes |
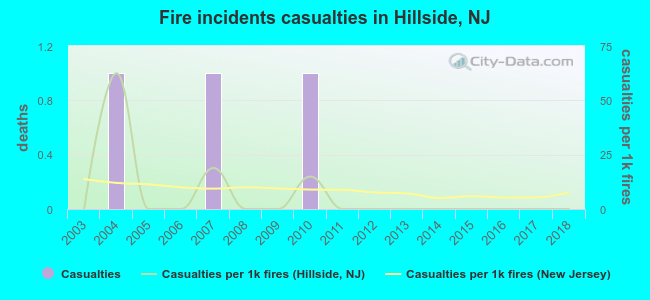 Based on the data from the years 2003 - 2018 the average number of fire-related casualties per year is 0. The highest number of reported injuries - 1 took place in 2004, and the lowest - 0 in 2003. The data has a constant trend.
The average number of injuries per 1,000 fire incidents is 6. This indicator was the highest - 63 in 2004, and the lowest 0 in 2003. The trend for injuries per 1,000 fires is constant. Compared to the state value the number of casualties per 1,000 fire incidents is much lower.
Based on the data from the years 2003 - 2018 the average number of fire-related casualties per year is 0. The highest number of reported injuries - 1 took place in 2004, and the lowest - 0 in 2003. The data has a constant trend.
The average number of injuries per 1,000 fire incidents is 6. This indicator was the highest - 63 in 2004, and the lowest 0 in 2003. The trend for injuries per 1,000 fires is constant. Compared to the state value the number of casualties per 1,000 fire incidents is much lower.
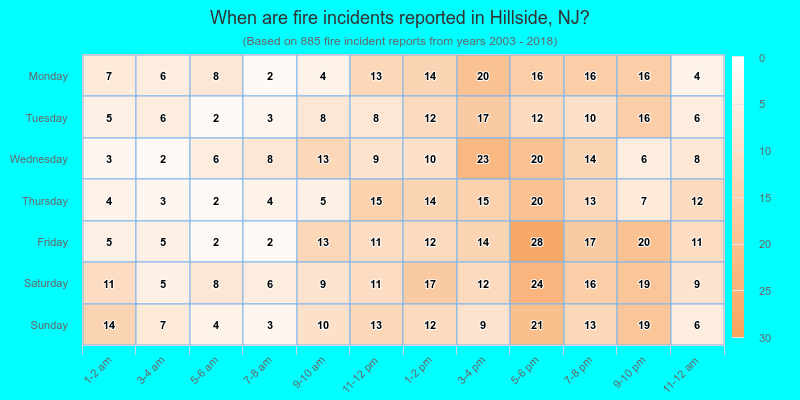
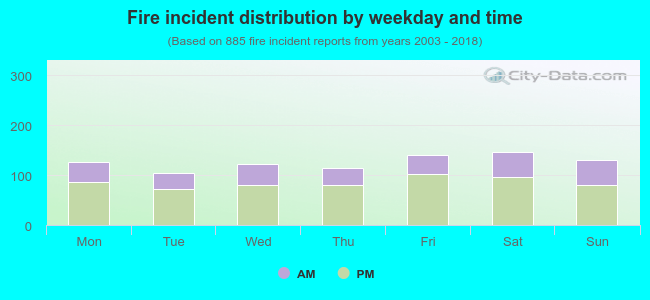 32.2% incidents where reported in the morning and 67.8% in the evening. The most fires (16.6%) took place on Saturday, and the least (11.9%) on Tuesday.
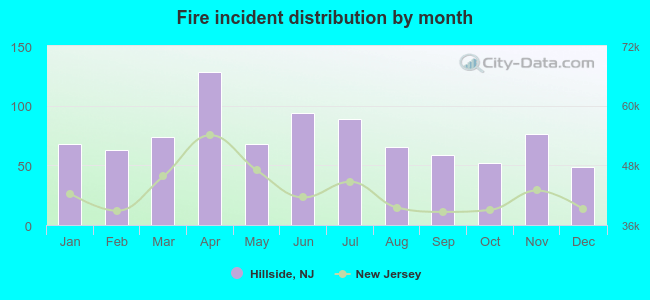 Based on the 885 reports from years 2003 - 2018 most fires (14.5%) took place during April, and the least (5.5%) in December.
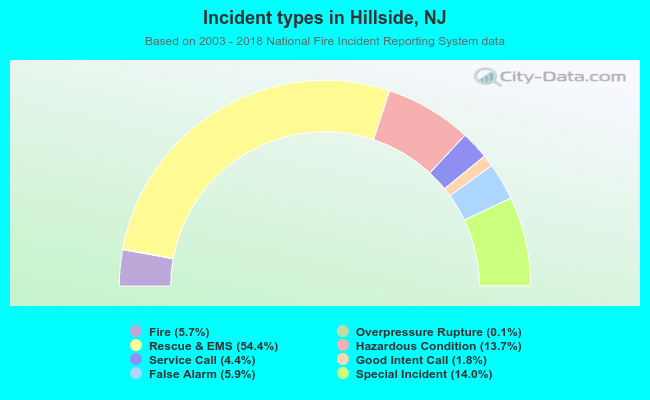 Out of all 15,581 cases reported during the years 2003 - 2018, the most belonged to the categories: Rescue & EMS (54.4%), Severe Weather (14.0%), and Hazardous Condition (13.7%).
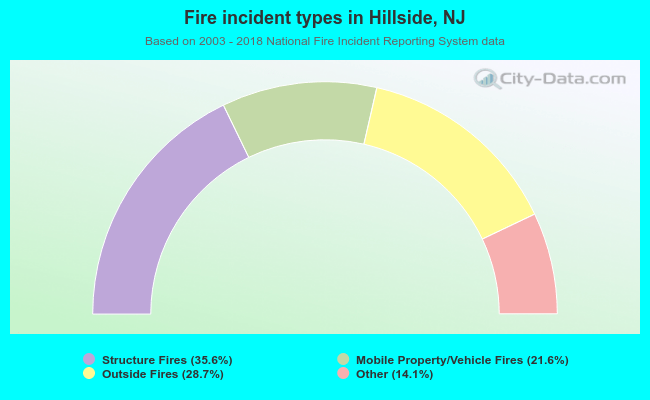 When looking into fire subcategories, the most reports belonged to: Structure Fires (35.6%), and Outside Fires (28.7%).