Homewood: Fire Incidents, Alabama (AL)
Where are fire incidents reported in Homewood, AL
Something went wrong! Please refresh the page.
| Fire incidents reported | |
|---|---|
| Sreet name | Count |
| GREEN SPRINGS HWY | 270 |
| OXMOOR RD | 215 |
| STATE FARM PKWY | 180 |
| VALLEY RIDGE DR | 144 |
| I65 | 115 |
| LAKESHORE PKWY | 110 |
| MEDICAL CENTER DR | 95 |
| LAKESHORE DR | 90 |
| WEST VALLEY AVE | 90 |
| ASPEN CIR | 85 |
| INDEPENDENCE DR | 80 |
| OXMOOR BLVD | 74 |
| ASPEN CV | 70 |
| COLUMBIANA RD | 70 |
| VALLEY AVE | 69 |
| ASPEN CT | 65 |
| EDGECREST DR | 65 |
| BROADWAY ST | 60 |
| LAKESHORE CT | 60 |
| OLD MONTGOMERY HWY | 60 |
| ROBERT JEMISON RD | 58 |
| OLYMPIA DR | 50 |
| 28TH AVE | 45 |
| 25TH CT | 40 |
| RALEIGH AVE | 40 |
| 18TH ST | 35 |
| 29TH AVE | 35 |
| MANSARD DR | 35 |
| WILDWOOD NORTH CIR | 35 |
| B M MONTGOMERY ST | 30 |
2003 - 2018 National Fire Incident Reporting System (NFIRS) incidents
- Incident types reported to NFIRS in Homewood, AL
- 9,11460.7%Rescue & EMS
- 1,93912.9%False Alarm
- 1,1487.6%Service Call
- 1,0326.9%Fire
- 8825.9%Hazardous Condition
- 7985.3%Good Intent Call
- 890.6%Severe Weather
- Fire incident types reported to NFIRS in Homewood, AL
- 45844.4%Structure Fires
- 31030.0%Outside Fires
- 23122.4%Mobile Property/Vehicle Fires
- 333.2%Other
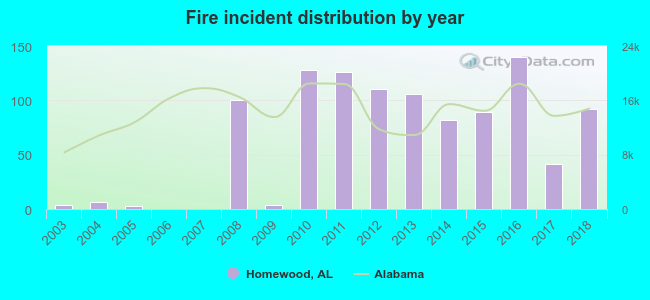 According to the data from the years 2003 - 2018 the average number of fires per year is 64. The highest number of reported fire incidents - 140 took place in 2016, and the least - 0 in 2006. The data has a growing trend.
The average number of yearly fire incidents per 10k residents in Homewood, AL compared to nearest cities:
(Note: Based on data for the last 3 years, including only cities with population 5,000 and above)
| Homewood: | 35.3 |
| Vestavia Hills: | 20.2 |
| Birmingham: | 87.0 |
| Mountain Brook: | 11.4 |
| Hoover: | 8.0 |
| Fairfield: | 8.2 |
| Midfield: | 63.3 |
| Irondale: | 55.7 |
| Tarrant: | 58.6 |
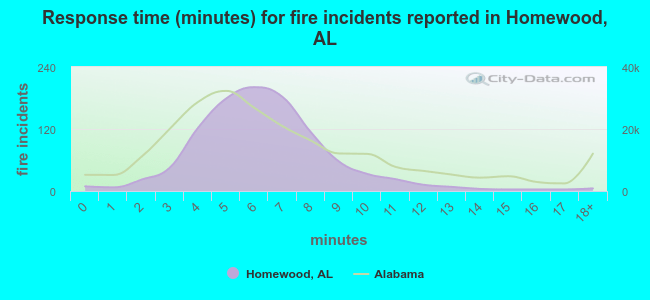 The median response time based on all reported fire incidents is 6 minutes. This is similar to the Alabama median value.
The median response time in Homewood, AL compared to nearest cities:
(Note: Based on data for all years, including only cities with at least 500 fire incidents)
| Homewood: | 6 minutes |
| Vestavia Hills: | 4 minutes |
| Birmingham: | 6 minutes |
| Hoover: | 5 minutes |
| Midfield: | 5 minutes |
| Irondale: | 5 minutes |
| Tarrant: | 3 minutes |
| Pleasant Grove: | 4 minutes |
| Bessemer: | 5 minutes |
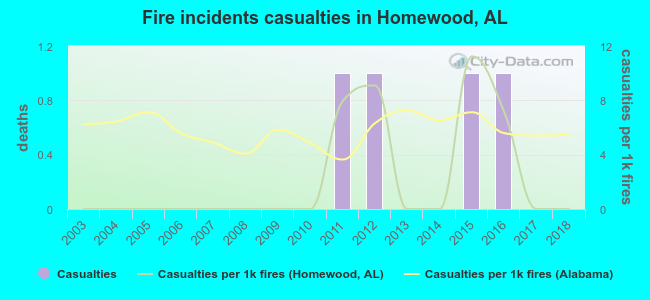 According to the reports from the years 2003 - 2018 the average number of fire-related casualties per year is 0. The highest number of casualties - 1 took place in 2011, and the lowest - 0 in 2003. The data has a constant trend.
The average number of injuries per 1,000 fire incidents is 2. This indicator was the highest - 11 in 2015, and the lowest 0 in 2003. The trend for injuries per 1,000 fire incidents is increasing. Compared to the state value the number of casualties per 1,000 fires is lower.
According to the reports from the years 2003 - 2018 the average number of fire-related casualties per year is 0. The highest number of casualties - 1 took place in 2011, and the lowest - 0 in 2003. The data has a constant trend.
The average number of injuries per 1,000 fire incidents is 2. This indicator was the highest - 11 in 2015, and the lowest 0 in 2003. The trend for injuries per 1,000 fire incidents is increasing. Compared to the state value the number of casualties per 1,000 fires is lower.Casualties per 1,000 incidents in Homewood, AL compared to nearest cities:
(Note: Based on data for all years, including only cities with at least 500 fire incidents)
| Homewood: | 3.9 |
| Vestavia Hills: | 19.5 |
| Birmingham: | 5.1 |
| Hoover: | 9.0 |
| Midfield: | 0.0 |
| Irondale: | 13.6 |
| Tarrant: | 3.9 |
| Pleasant Grove: | 5.3 |
| Bessemer: | 5.0 |
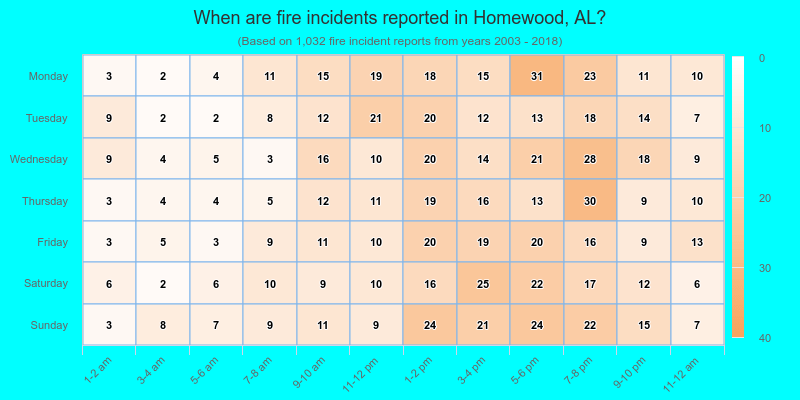
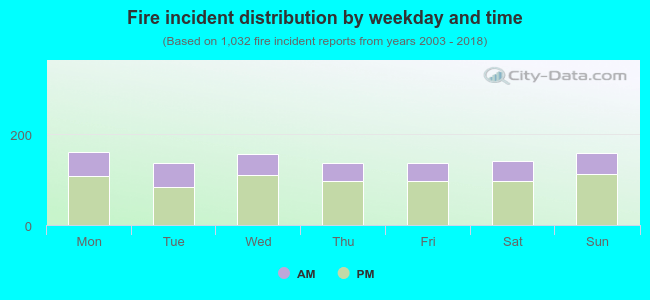 31.5% incidents where reported in the morning and 68.5% in the evening. The most fires (15.7%) took place on Monday, and the least (13.2%) on Thursday.
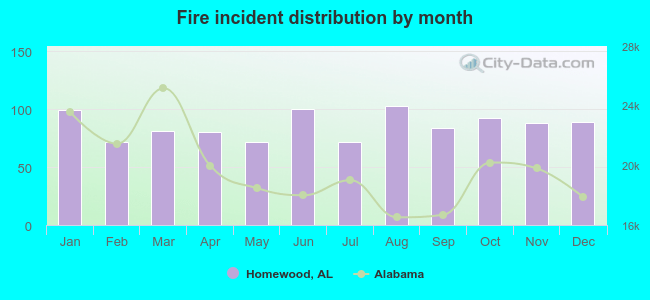 According to the 1,032 fire incident reports from years 2003 - 2018 most fires (10.0%) took place during August, and the least (7.0%) in February.
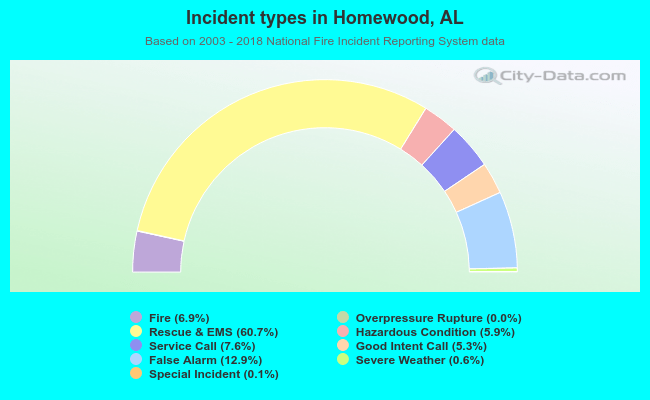 Out of all 15,020 cases reported during the years 2003 - 2018, the most belonged to the categories: Rescue & EMS (60.7%), False Alarm (12.9%), and Service Call (7.6%).
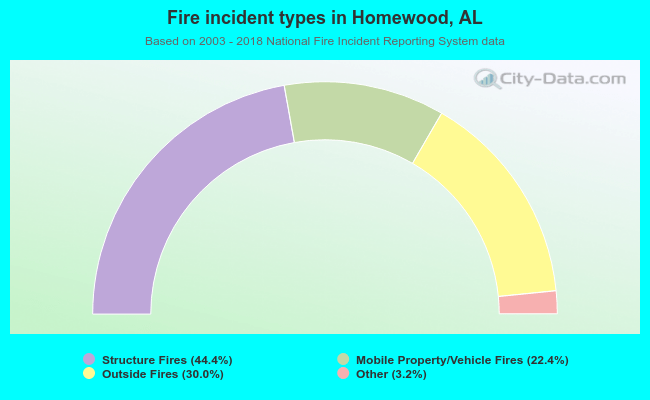 When looking into fire subcategories, the most reports belonged to: Structure Fires (44.4%), and Outside Fires (30.0%).