Houma: Fire Incidents, Louisiana (LA)
Where are fire incidents reported in Houma, LA
Something went wrong! Please refresh the page.
| Fire incidents reported | |
|---|---|
| Sreet name | Count |
| MAIN ST | 468 |
| PARK AVE | 382 |
| GRAND CAILLOU RD | 326 |
| MARTIN LUTHER KING BLVD | 182 |
| TUNNEL BLVD | 158 |
| BAYOU BLUE RD | 148 |
| COTEAU RD | 148 |
| WESTSIDE BLVD | 134 |
| 311 HWY | 92 |
| HWY 182 | 90 |
| HOLLYWOOD RD | 86 |
| BAYOU BLACK DR | 78 |
| EAST ST | 74 |
| MONARCH DR | 74 |
| SENATOR CIR | 74 |
| SAVANNE RD | 68 |
| BARROW ST | 60 |
| BAYOU DULARGE RD | 58 |
| AUTHEMENT ST | 56 |
| BAYOU GARDENS BLVD | 54 |
| LAFAYETTE ST | 54 |
| GOUAUX AVE | 48 |
| HWY 311 | 48 |
| PROSPECT BLVD | 48 |
| THOMPSON RD | 46 |
| MARIETTA PL | 44 |
| LABAN AVE | 42 |
| ST CHARLES ST | 42 |
| VAN AVE | 42 |
| MATTHEWS CT | 40 |
| Other | 1,678 |
2002 - 2018 National Fire Incident Reporting System (NFIRS) incidents
- Incident types reported to NFIRS in Houma, LA
- 12,93345.9%Rescue & EMS
- 4,94217.5%Fire
- 4,81717.1%Hazardous Condition
- 3,12011.1%False Alarm
- 1,5945.7%Good Intent Call
- 6862.4%Service Call
- 410.1%Overpressure Rupture
- 330.1%Severe Weather
- Fire incident types reported to NFIRS in Houma, LA
- 2,24445.4%Outside Fires
- 1,73835.2%Structure Fires
- 83416.9%Mobile Property/Vehicle Fires
- 1262.5%Other
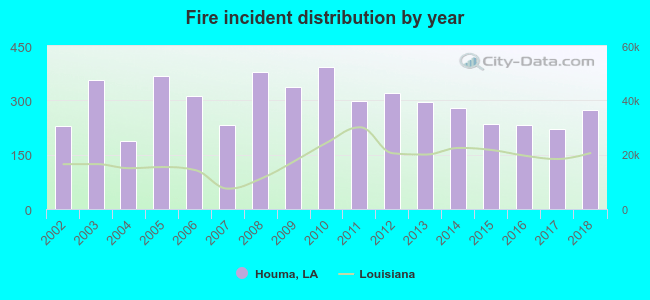 Based on the data from the years 2002 - 2018 the average number of fire incidents per year is 291. The highest number of reported fires - 392 took place in 2010, and the least - 187 in 2004. The data has a rising trend.
The average number of yearly fire incidents per 10k residents in Houma, LA compared to nearest cities:
(Note: Based on data for the last 3 years, including only cities with population 5,000 and above)
| Houma: | 70.9 |
| Central: | 0.7 |
| Gray: | 16.1 |
| Raceland: | 64.4 |
| Schriever: | 20.9 |
| Thibodaux: | 55.5 |
| Larose: | 45.0 |
| Cut Off: | 59.1 |
| Galliano: | 66.0 |
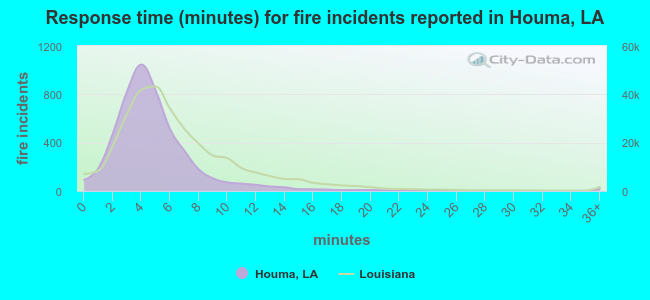 The median response time based on all reported fire incidents is 4 minutes. This is lower compared to the state median value.
The median response time in Houma, LA compared to nearest cities:
(Note: Based on data for all years, including only cities with at least 500 fire incidents)
| Houma: | 4 minutes |
| Raceland: | 5 minutes |
| Thibodaux: | 4 minutes |
| Galliano: | 5 minutes |
| Luling: | 7 minutes |
| Reserve: | 5 minutes |
| Laplace: | 6 minutes |
| Avondale: | 3 minutes |
| Donaldsonville: | 4 minutes |
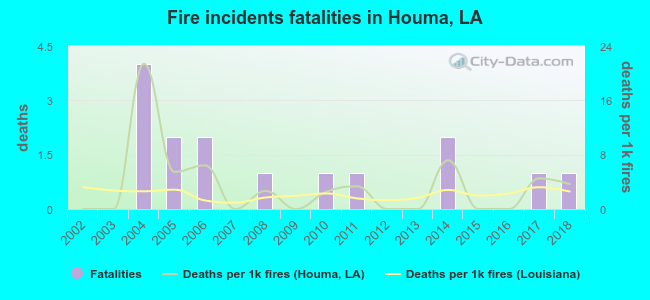 Based on the data from the years 2002 - 2018 the average number of fire-related fatalities per year is 1. The highest number of deaths - 4 took place in 2004, and the lowest - 0 in 2002. The data has an increasing trend.
The average number of deaths per 1,000 fire incidents is 3. This indicator was the highest - 21 in 2004, and the lowest 0 in 2002. The trend for deaths per 1,000 incidents is growing. Compared to the state value the number of deaths per 1,000 fire incidents is higher.
Based on the data from the years 2002 - 2018 the average number of fire-related fatalities per year is 1. The highest number of deaths - 4 took place in 2004, and the lowest - 0 in 2002. The data has an increasing trend.
The average number of deaths per 1,000 fire incidents is 3. This indicator was the highest - 21 in 2004, and the lowest 0 in 2002. The trend for deaths per 1,000 incidents is growing. Compared to the state value the number of deaths per 1,000 fire incidents is higher.Deaths per 1,000 incidents in Houma, LA compared to nearest cities:
(Note: Based on data for all years, including only cities with at least 2,500 fire incidents)
| Houma: | 3.0 |
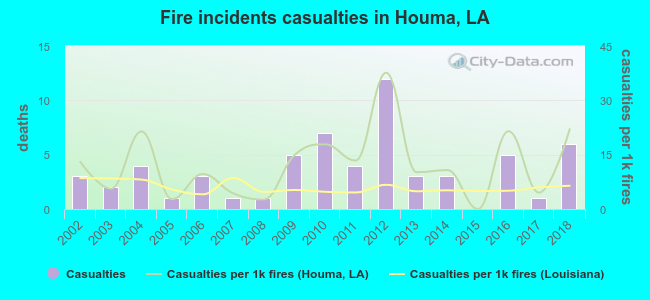 According to the data from the years 2002 - 2018 the average number of fire-related yearly casualties is 4. The highest number of reported casualties - 12 took place in 2012, and the lowest - 0 in 2015. The data has a growing trend.
The average number of casualties per 1,000 fire incidents is 12. This indicator was the highest - 38 in 2012, and the lowest 0 in 2015. The trend for injuries per 1,000 incidents is increasing. Compared to the state value the number of injuries per 1,000 incidents is much higher.
According to the data from the years 2002 - 2018 the average number of fire-related yearly casualties is 4. The highest number of reported casualties - 12 took place in 2012, and the lowest - 0 in 2015. The data has a growing trend.
The average number of casualties per 1,000 fire incidents is 12. This indicator was the highest - 38 in 2012, and the lowest 0 in 2015. The trend for injuries per 1,000 incidents is increasing. Compared to the state value the number of injuries per 1,000 incidents is much higher.
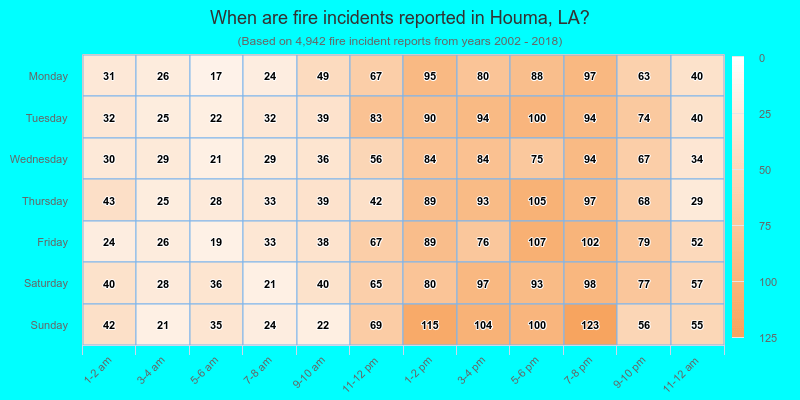
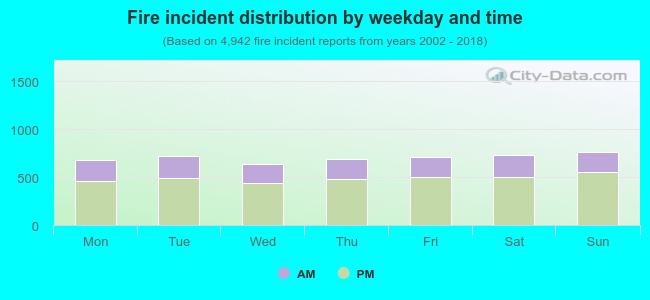 30.5% incidents where reported in the morning and 69.5% in the evening. The most fires (15.5%) took place on Sunday, and the least (12.9%) on Wednesday.
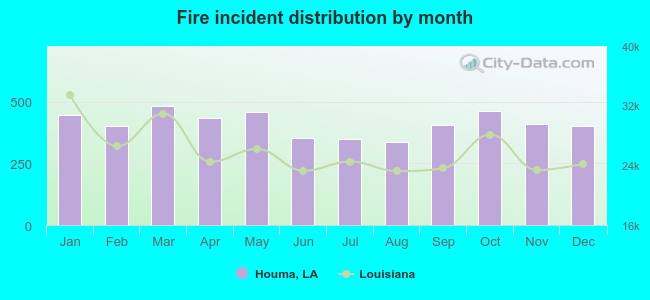 Based on the 4,942 fires from years 2002 - 2018 most fires (9.8%) took place during March, and the least (6.8%) in August.
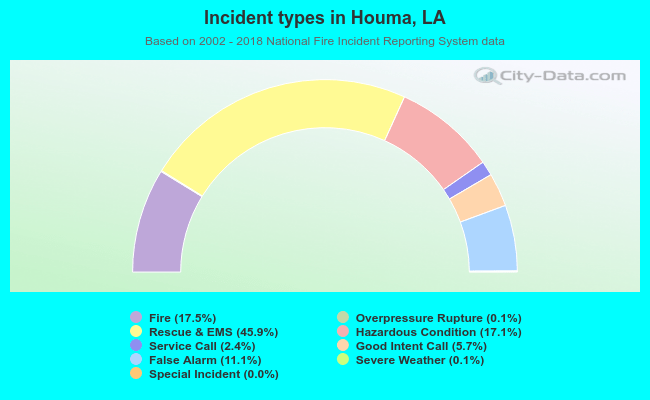 Out of all 28,176 cases reported during the years 2002 - 2018, the most belonged to the categories: Rescue & EMS (45.9%), Fire (17.5%), and Hazardous Condition (17.1%).
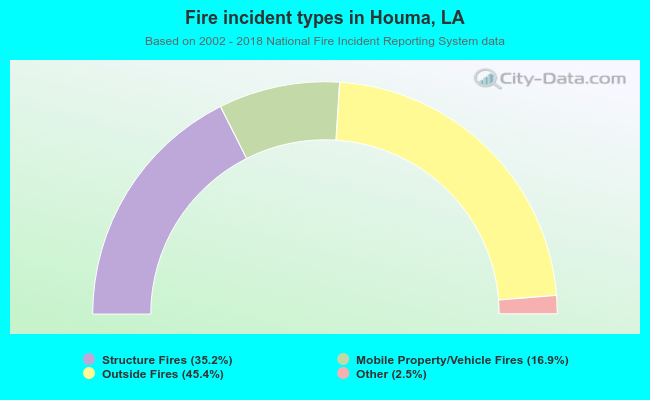 When looking into fire subcategories, the most reports belonged to: Outside Fires (45.4%), and Structure Fires (35.2%).