Hugo: Fire Incidents, Oklahoma (OK)
Where are fire incidents reported in Hugo, OK
Something went wrong! Please refresh the page.
| Fire incidents reported | |
|---|---|
| Sreet name | Count |
| JACKSON | 30 |
| HWY 70 | 28 |
| HWY 70 EAST | 22 |
| JACKSON ST | 22 |
| DUKE ST | 20 |
| BROADWAY | 18 |
| H ST | 18 |
| KIRK | 18 |
| E ST | 16 |
| LOWERY PARKWAY | 16 |
| 2090 RD | 14 |
| 5TH ST | 14 |
| INDIAN NATION TURNPIKE | 14 |
| KIAMICHI | 14 |
| KIAMICHI ST | 14 |
| 2070 RD | 12 |
| 3RD ST | 12 |
| 70 HWY | 12 |
| A ST | 12 |
| BLUFF | 12 |
| BLUFF ST | 12 |
| DUKE | 12 |
| F ST | 12 |
| J ST | 12 |
| K ST | 12 |
| 271 HWY | 10 |
| 4200 RD | 10 |
| BROADWAY ST | 10 |
| CENTRAL | 10 |
| H | 10 |
| Other | 1,309 |
2004 - 2018 National Fire Incident Reporting System (NFIRS) incidents
- Incident types reported to NFIRS in Hugo, OK
- 1,75773.0%Fire
- 2138.8%Hazardous Condition
- 1737.2%Good Intent Call
- 1606.6%Service Call
- 572.4%False Alarm
- 431.8%Rescue & EMS
- Fire incident types reported to NFIRS in Hugo, OK
- 1,09762.4%Outside Fires
- 45726.0%Structure Fires
- 1408.0%Mobile Property/Vehicle Fires
- 633.6%Other
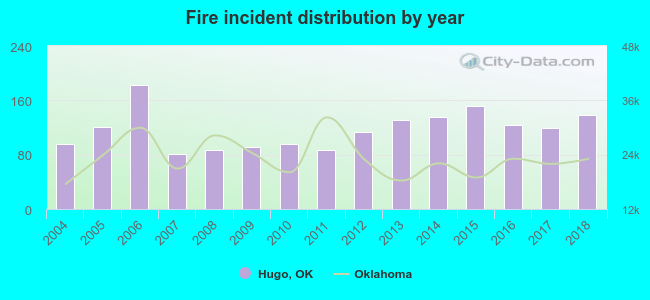 According to the data from the years 2004 - 2018 the average number of fires per year is 117. The highest number of reported fires - 183 took place in 2006, and the least - 81 in 2007. The data has a growing trend.
 The median response time based on all reported fire incidents is 5 minutes. This is lower compared to the state median value.
The median response time in Hugo, OK compared to nearest cities:
(Note: Based on data for all years, including only cities with at least 500 fire incidents)
| Hugo: | 5 minutes |
| Antlers: | 8 minutes |
| Idabel: | 5 minutes |
| Atoka: | 9 minutes |
| Broken Bow: | 7 minutes |
| Durant: | 4 minutes |
 According to the reports from the years 2004 - 2018 the average number of fire-related yearly casualties is 0. The highest number of reported casualties - 1 took place in 2004, and the lowest - 0 in 2005. The data has a dropping trend.
The average number of casualties per 1,000 fire incidents is 3. This indicator was the highest - 12 in 2007, and the lowest 0 in 2005. The trend for casualties per 1,000 fires is dropping. Compared to the state value the number of injuries per 1,000 fires is lower.
According to the reports from the years 2004 - 2018 the average number of fire-related yearly casualties is 0. The highest number of reported casualties - 1 took place in 2004, and the lowest - 0 in 2005. The data has a dropping trend.
The average number of casualties per 1,000 fire incidents is 3. This indicator was the highest - 12 in 2007, and the lowest 0 in 2005. The trend for casualties per 1,000 fires is dropping. Compared to the state value the number of injuries per 1,000 fires is lower.Casualties per 1,000 incidents in Hugo, OK compared to nearest cities:
(Note: Based on data for all years, including only cities with at least 500 fire incidents)
| Hugo: | 2.3 |
| Antlers: | 1.1 |
| Idabel: | 1.1 |
| Atoka: | 0.0 |
| Broken Bow: | 0.0 |
| Durant: | 2.2 |
 29.1% incidents where reported in the morning and 70.9% in the evening. The most fires (15.3%) took place on Saturday, and the least (13.5%) on Wednesday.
 According to the 1,757 fire incidents from years 2004 - 2018 most fires (11.7%) took place during January, and the least (5.0%) in May.
 Out of all 2,408 cases reported during the years 2004 - 2018, the most belonged to the categories: Fire (73.0%), Hazardous Condition (8.8%), and Good Intent Call (7.2%).
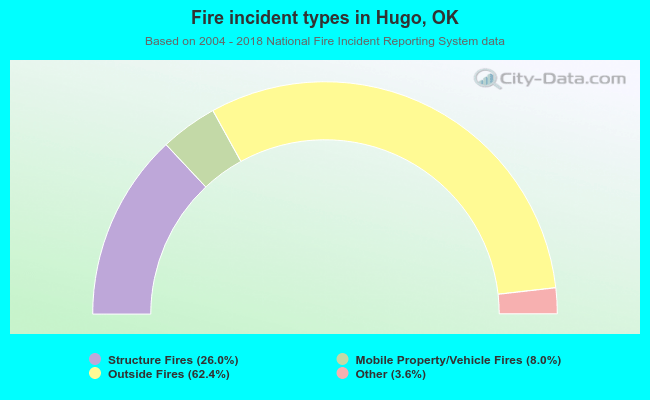 When looking into fire subcategories, the most reports belonged to: Outside Fires (62.4%), and Structure Fires (26.0%).