Huntsville: Fire Incidents, Texas (TX)
Where are fire incidents reported in Huntsville, TX
Something went wrong! Please refresh the page.
| Fire incidents reported | |
|---|---|
| Sreet name | Count |
| IH 45 | 94 |
| FM 980 | 80 |
| FM 1696 | 62 |
| IH-45 HWY | 50 |
| SH-75 HWY | 36 |
| FM 230 | 34 |
| SH 75 | 34 |
| PINEDALE | 30 |
| SH 30 | 28 |
| FM 1696 HWY | 26 |
| FM 247 | 26 |
| FM 3478 | 26 |
| FM 405 | 26 |
| FM 3179 | 24 |
| BISHOP | 20 |
| FM 1696 W | 18 |
| FM 1696 WEST | 18 |
| US 190 | 18 |
| 2501 LAKE RD | 16 |
| DICKEY LOOP | 16 |
| FM 1374 | 16 |
| FM 2550 | 16 |
| FM 2989 | 16 |
| HOPEWELL RD | 16 |
| INTERSTATE 45 | 16 |
| INTERSTATE 45 NB | 16 |
| WALKER LOOP | 16 |
| 555 BOWERS BLVD | 14 |
| FM 2793 | 14 |
| HWY 19 | 14 |
| Other | 3,870 |
2002 - 2018 National Fire Incident Reporting System (NFIRS) incidents
- Incident types reported to NFIRS in Huntsville, TX
- 4,70632.4%Fire
- 2,88419.9%Rescue & EMS
- 2,38116.4%Good Intent Call
- 2,10914.5%Hazardous Condition
- 1,80012.4%Service Call
- 5864.0%False Alarm
- 280.2%Special Incident
- Fire incident types reported to NFIRS in Huntsville, TX
- 2,44151.9%Outside Fires
- 1,36929.1%Structure Fires
- 74415.8%Mobile Property/Vehicle Fires
- 1523.2%Other
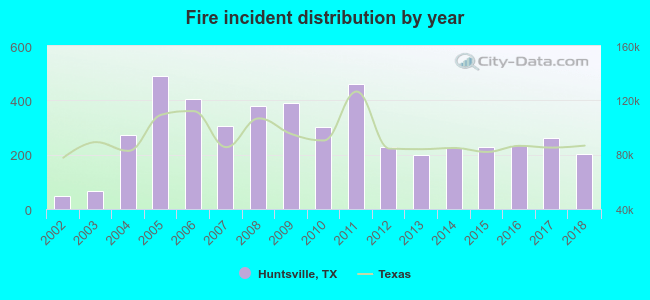 Based on the data from the years 2002 - 2018 the average number of fires per year is 277. The highest number of reported fire incidents - 489 took place in 2005, and the least - 49 in 2002. The data has an increasing trend.
The average number of yearly fire incidents per 10k residents in Huntsville, TX compared to nearest cities:
(Note: Based on data for the last 3 years, including only cities with population 5,000 and above)
| Huntsville: | 57.7 |
| Willis: | 247.0 |
| Conroe: | 106.3 |
| Livingston: | 316.0 |
| The Woodlands: | 14.3 |
| Cleveland: | 466.1 |
| Navasota: | 165.5 |
| Crockett: | 76.2 |
| Tomball: | 209.2 |
 The median response time based on all reported fire incidents is 10 minutes. This is higher than the Texas median value.
The median response time in Huntsville, TX compared to nearest cities:
(Note: Based on data for all years, including only cities with at least 500 fire incidents)
| Huntsville: | 10 minutes |
| New Waverly: | 9 minutes |
| Trinity: | 8 minutes |
| Point Blank: | 14 minutes |
| Willis: | 9 minutes |
| Montgomery: | 8 minutes |
| Coldspring: | 12 minutes |
| Conroe: | 7 minutes |
| Lovelady: | 13 minutes |
 Based on the reports from the years 2002 - 2018 the average number of fire-related casualties per year is 1. The highest number of reported casualties - 4 took place in 2014, and the lowest - 0 in 2002. The data has a constant trend.
The average number of injuries per 1,000 fires is 3. This indicator was the highest - 18 in 2014, and the lowest 0 in 2002. The trend for injuries per 1,000 fire incidents is growing. Compared to the Texas value the number of injuries per 1,000 fire incidents is much lower.
Based on the reports from the years 2002 - 2018 the average number of fire-related casualties per year is 1. The highest number of reported casualties - 4 took place in 2014, and the lowest - 0 in 2002. The data has a constant trend.
The average number of injuries per 1,000 fires is 3. This indicator was the highest - 18 in 2014, and the lowest 0 in 2002. The trend for injuries per 1,000 fire incidents is growing. Compared to the Texas value the number of injuries per 1,000 fire incidents is much lower.Casualties per 1,000 incidents in Huntsville, TX compared to nearest cities:
(Note: Based on data for all years, including only cities with at least 500 fire incidents)
| Huntsville: | 3.0 |
| New Waverly: | 1.1 |
| Trinity: | 0.0 |
| Point Blank: | 0.0 |
| Willis: | 9.8 |
| Montgomery: | 7.5 |
| Coldspring: | 1.5 |
| Conroe: | 7.3 |
| Lovelady: | 0.0 |
 26.7% incidents where reported in the morning and 73.3% in the evening. The most fires (16.3%) took place on Sunday, and the least (13.0%) on Thursday.
 According to the 4,706 fire incident reports from years 2002 - 2018 most fires (10.6%) took place during August, and the least (6.4%) in November.
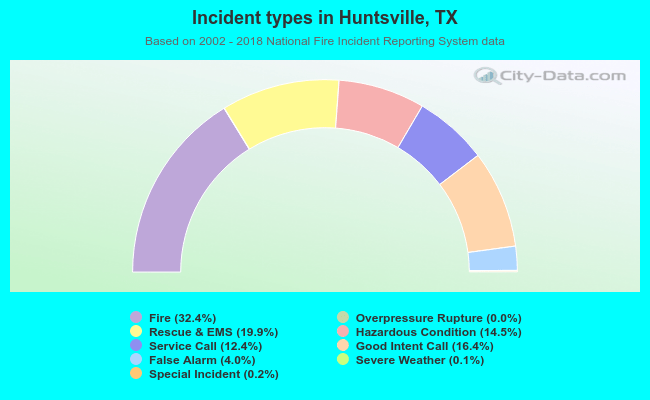 Out of all 14,511 cases reported during the years 2002 - 2018, the most belonged to the categories: Fire (32.4%), Rescue & EMS (19.9%), and Good Intent Call (16.4%).
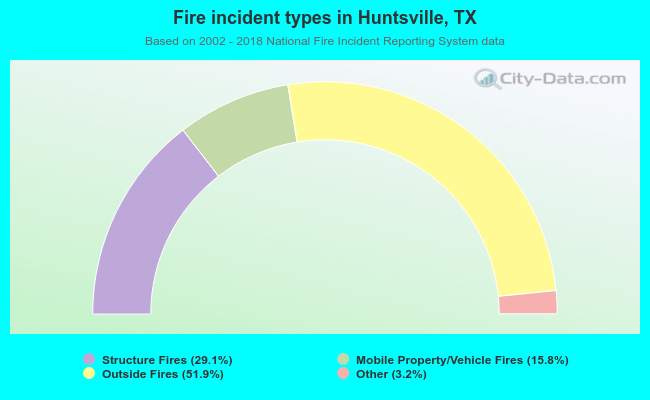 When looking into fire subcategories, the most reports belonged to: Outside Fires (51.9%), and Structure Fires (29.1%).