Hyde Park: Fire Incidents, New York (NY)
Where are fire incidents reported in Hyde Park, NY
Something went wrong! Please refresh the page.
| Fire incidents reported | |
|---|---|
| Sreet name | Count |
| ALBANY POST RD | 156 |
| ROUTE 9G | 120 |
| ALBANY POST ROAD | 114 |
| VIOLET AVE | 92 |
| HOOK RD | 90 |
| CARDINAL RD | 80 |
| MARKET ST | 60 |
| CAMPUS DR | 58 |
| CRUM ELBOW RD | 56 |
| QUAKER LN | 52 |
| CREAM ST | 44 |
| VIOLET | 44 |
| VIOLET AV | 40 |
| EAST MARKET STREET | 38 |
| PARTRIDGE HILL RD | 36 |
| CARDINAL ROAD | 34 |
| HAVILAND RD | 34 |
| DORSEY LN | 30 |
| VIOLET AVENUE | 30 |
| CREEK RD | 26 |
| CRUM ELBOW ROAD | 22 |
| GREENTREE DR | 22 |
| HONEYWELL LN | 20 |
| FARM LANE | 18 |
| FIFTH CT | 18 |
| HOLT RD | 18 |
| LAWRENCE RD | 18 |
| ROOSEVELT RD | 18 |
| WEST RD | 18 |
| BENNETT RD | 16 |
| Other | 277 |
2002 - 2018 National Fire Incident Reporting System (NFIRS) incidents
- Incident types reported to NFIRS in Hyde Park, NY
- 6,51050.9%Rescue & EMS
- 1,85114.5%Good Intent Call
- 1,69913.3%Fire
- 1,36110.6%False Alarm
- 1,0067.9%Hazardous Condition
- 3202.5%Service Call
- 200.2%Severe Weather
- Fire incident types reported to NFIRS in Hyde Park, NY
- 1,20170.7%Structure Fires
- 33219.5%Outside Fires
- 1116.5%Mobile Property/Vehicle Fires
- 553.2%Other
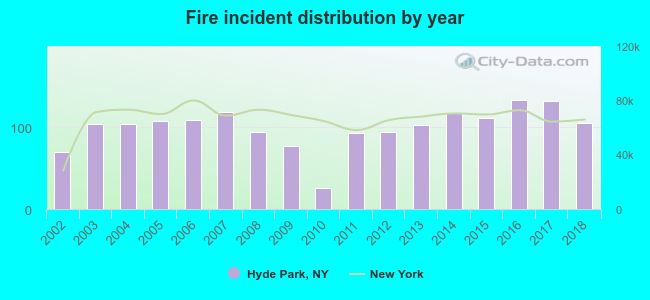 According to the data from the years 2002 - 2018 the average number of fire incidents per year is 100. The highest number of fires - 133 took place in 2016, and the least - 26 in 2010. The data has a rising trend.
The average number of yearly fire incidents per 10k residents in Hyde Park, NY compared to nearest cities:
(Note: Based on data for the last 3 years, including only cities with population 5,000 and above)
| Hyde Park: | 57.2 |
| Fairview: | 1.8 |
| Highland: | 51.9 |
| Esopus: | 8.8 |
| Poughkeepsie: | 271.6 |
| Lloyd: | 1.8 |
| New Paltz: | 63.6 |
| Rosendale: | 3.8 |
| Kingston: | 90.1 |
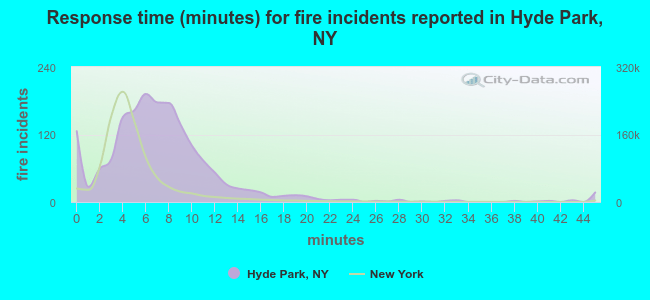 The median response time based on all reported fire incidents is 7 minutes. This is higher compared to the New York median value.
The median response time in Hyde Park, NY compared to nearest cities:
(Note: Based on data for all years, including only cities with at least 500 fire incidents)
| Hyde Park: | 7 minutes |
| Pleasant Valley: | 7 minutes |
| Poughkeepsie: | 5 minutes |
| New Paltz: | 5 minutes |
| Kingston: | 3 minutes |
| Millbrook: | 10 minutes |
| Wappingers Falls: | 6 minutes |
| Hopewell Junction: | 9 minutes |
| Fishkill: | 5 minutes |
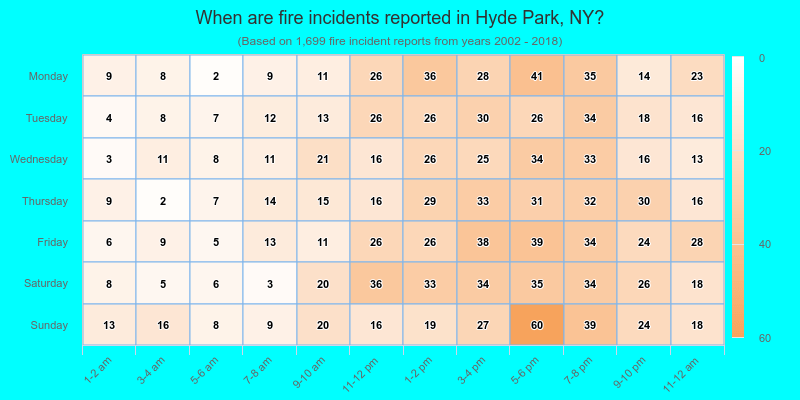
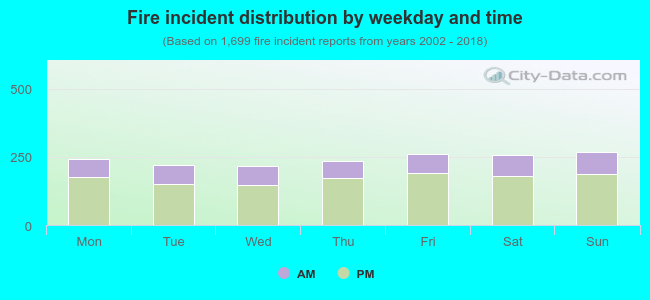 29.3% incidents where reported in the morning and 70.7% in the evening. The most fires (15.8%) took place on Sunday, and the least (12.8%) on Wednesday.
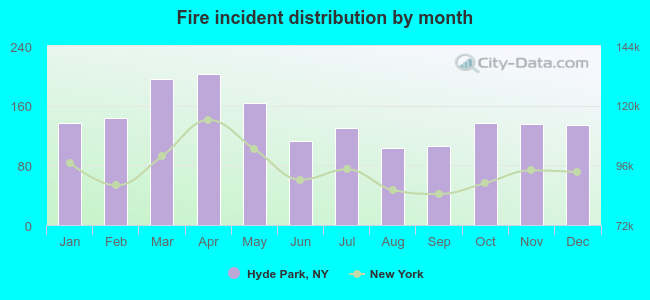 According to the 1,699 incident reports from years 2002 - 2018 most fires (11.9%) took place during April, and the least (6.1%) in August.
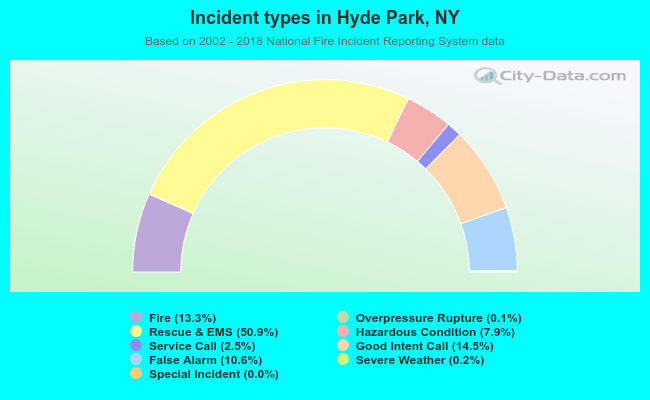 Out of all 12,782 cases reported during the years 2002 - 2018, the most belonged to the categories: Rescue & EMS (50.9%), Good Intent Call (14.5%), and Fire (13.3%).
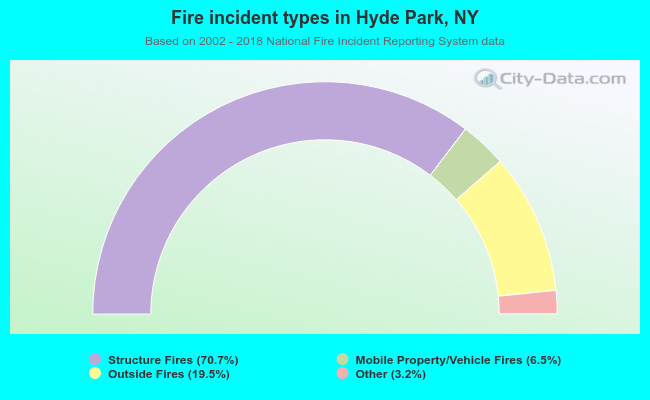 When looking into fire subcategories, the most incidents belonged to: Structure Fires (70.7%), and Outside Fires (19.5%).