Jacksonville: Fire Incidents, North Carolina (NC)
Where are fire incidents reported in Jacksonville, NC
Something went wrong! Please refresh the page.
| Fire incidents reported | |
|---|---|
| Sreet name | Count |
| GUM BRANCH RD | 200 |
| WESTERN BLVD | 168 |
| PINEY GREEN RD | 142 |
| BURGAW HWY | 114 |
| WILMINGTON HWY | 110 |
| RICHLANDS HWY | 106 |
| WESTERN BLV | 96 |
| BLUE CREEK RD | 78 |
| NEW BERN HWY | 72 |
| RAMSEY RD | 60 |
| ARAGONA BLVD | 54 |
| HALLTOWN RD | 54 |
| MARINE BLVD | 54 |
| ROCKY RUN RD | 50 |
| DRUMMER KELLUM RD | 48 |
| HUNTING GREEN DR | 48 |
| LEJEUNE BLVD | 44 |
| PONY FARM RD | 42 |
| CANADY RD | 40 |
| HWY 17 | 40 |
| THOMAS HUMPHREY RD | 40 |
| WHITE ST | 40 |
| COUNTRY CLUB RD | 38 |
| DAWSON CABIN RD | 38 |
| KELLUM LOOP RD | 38 |
| MARINE BLV | 36 |
| BEN WILLIAMS RD | 34 |
| NEW RIVER DR | 34 |
| RHODESTOWN RD | 34 |
| COLEMAN DR | 32 |
| Other | 1,638 |
2002 - 2018 National Fire Incident Reporting System (NFIRS) incidents
- Incident types reported to NFIRS in Jacksonville, NC
- 11,24643.2%Rescue & EMS
- 3,62213.9%Fire
- 3,57513.7%Good Intent Call
- 3,03311.7%False Alarm
- 2,86611.0%Hazardous Condition
- 1,1714.5%Service Call
- 4261.6%Overpressure Rupture
- 580.2%Special Incident
- 360.1%Severe Weather
- Fire incident types reported to NFIRS in Jacksonville, NC
- 1,76848.8%Structure Fires
- 1,29635.8%Outside Fires
- 39811.0%Mobile Property/Vehicle Fires
- 1604.4%Other
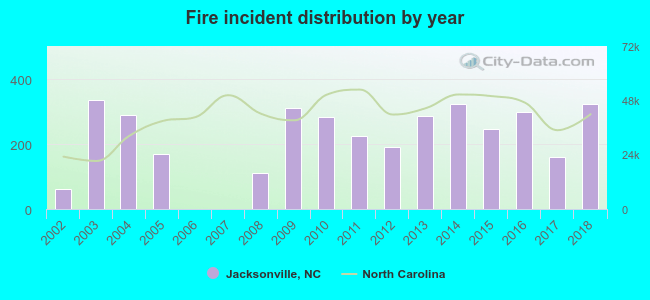 According to the data from the years 2002 - 2018 the average number of fires per year is 213. The highest number of reported fire incidents - 335 took place in 2003, and the least - 0 in 2006. The data has a growing trend.
The average number of yearly fire incidents per 10k residents in Jacksonville, NC compared to nearest cities:
(Note: Based on data for the last 3 years, including only cities with population 5,000 and above)
| Jacksonville: | 37.7 |
| Half Moon: | 4.4 |
| Piney Green: | 3.0 |
| Havelock: | 30.4 |
| James City: | 11.0 |
| New Bern: | 57.9 |
| Kinston: | 81.3 |
| Morehead City: | 61.9 |
| Ogden: | 1.5 |
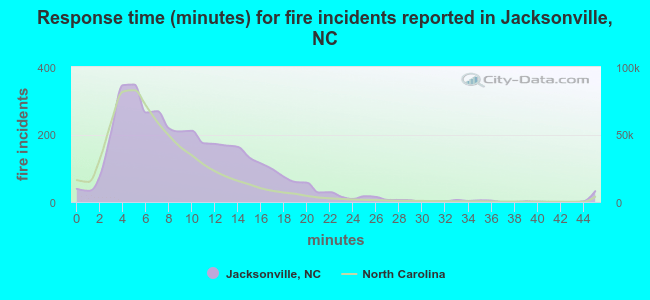 The median response time based on all reported fire incidents is 9 minutes. This is higher compared to the North Carolina median value.
The median response time in Jacksonville, NC compared to nearest cities:
(Note: Based on data for all years, including only cities with at least 500 fire incidents)
| Jacksonville: | 9 minutes |
| Richlands: | 11 minutes |
| Sneads Ferry: | 10 minutes |
| Swansboro: | 8 minutes |
| Holly Ridge: | 9 minutes |
| Trenton: | 10 minutes |
| Emerald Isle: | 6 minutes |
| Beulaville: | 10 minutes |
| Havelock: | 10 minutes |
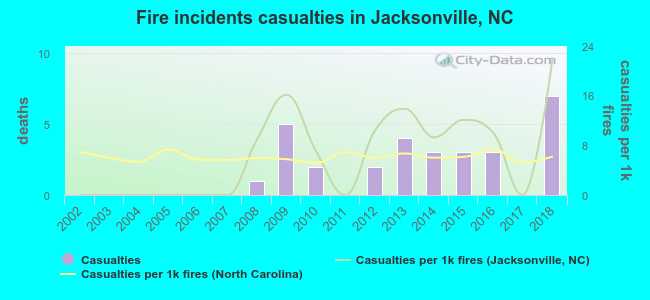 According to the data from the years 2002 - 2018 the average number of fire-related yearly casualties is 2. The highest number of reported injuries - 7 took place in 2018, and the lowest - 0 in 2002. The data has a rising trend.
The average number of injuries per 1,000 fires is 6. This indicator was the highest - 22 in 2018, and the lowest 0 in 2002. The trend for casualties per 1,000 fire incidents is growing. Compared to the North Carolina value the number of casualties per 1,000 fires is higher.
According to the data from the years 2002 - 2018 the average number of fire-related yearly casualties is 2. The highest number of reported injuries - 7 took place in 2018, and the lowest - 0 in 2002. The data has a rising trend.
The average number of injuries per 1,000 fires is 6. This indicator was the highest - 22 in 2018, and the lowest 0 in 2002. The trend for casualties per 1,000 fire incidents is growing. Compared to the North Carolina value the number of casualties per 1,000 fires is higher.Casualties per 1,000 incidents in Jacksonville, NC compared to nearest cities:
(Note: Based on data for all years, including only cities with at least 500 fire incidents)
| Jacksonville: | 8.3 |
| Richlands: | 0.0 |
| Sneads Ferry: | 0.0 |
| Swansboro: | 10.8 |
| Holly Ridge: | 3.6 |
| Trenton: | 0.0 |
| Emerald Isle: | 0.0 |
| Beulaville: | 0.0 |
| Havelock: | 3.2 |
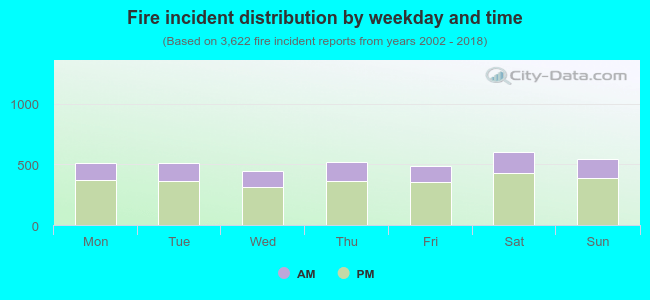 28.8% incidents where reported in the morning and 71.2% in the evening. The most fires (16.7%) took place on Saturday, and the least (12.3%) on Wednesday.
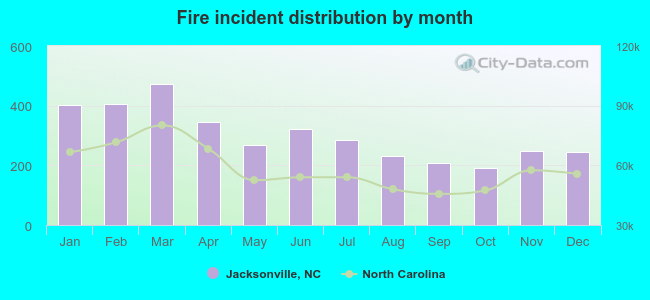 Based on the 3,622 fire incident reports from years 2002 - 2018 most fires (13.1%) took place during March, and the least (5.3%) in October.
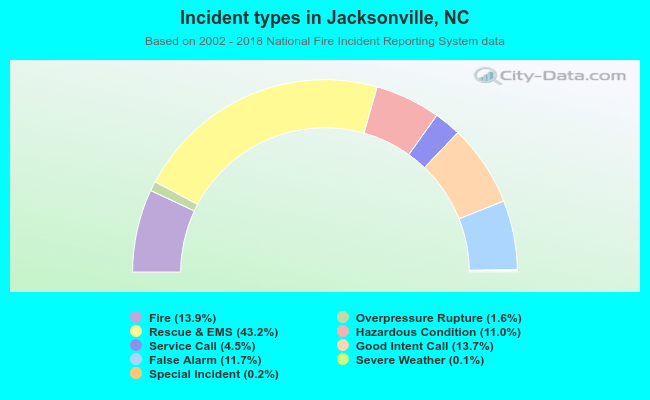 Out of all 26,033 cases reported during the years 2002 - 2018, the most belonged to the categories: Rescue & EMS (43.2%), Fire (13.9%), and Good Intent Call (13.7%).
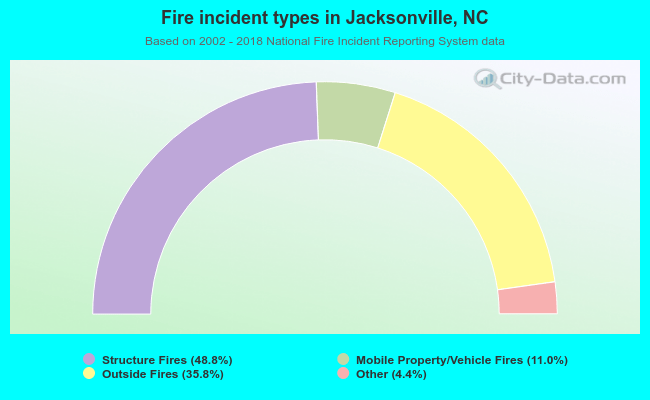 When looking into fire subcategories, the most incidents belonged to: Structure Fires (48.8%), and Outside Fires (35.8%).