Key Biscayne: Fire Incidents, Florida (FL)
Where are fire incidents reported in Key Biscayne, FL
Something went wrong! Please refresh the page.
|
| |||||||||||||||||||||||||||||||||||||||||||||||||||||||||||||||||||||||||||||||||||||||||||||||||||||||||||||
2004 - 2018 National Fire Incident Reporting System (NFIRS) incidents
- Incident types reported to NFIRS in Key Biscayne, FL
- 3,93746.9%Rescue & EMS
- 2,25226.8%False Alarm
- 6928.2%Service Call
- 6748.0%Fire
- 5867.0%Hazardous Condition
- 2422.9%Good Intent Call
- Fire incident types reported to NFIRS in Key Biscayne, FL
- 41561.6%Structure Fires
- 16224.0%Outside Fires
- 598.8%Other
- 385.6%Mobile Property/Vehicle Fires
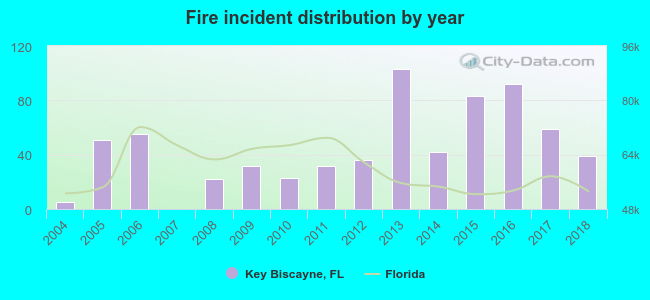 Based on the data from the years 2004 - 2018 the average number of fires per year is 45. The highest number of fire incidents - 103 took place in 2013, and the least - 0 in 2007. The data has a growing trend.
The average number of yearly fire incidents per 10k residents in Key Biscayne, FL compared to nearest cities:
(Note: Based on data for the last 3 years, including only cities with population 5,000 and above)
| Key Biscayne: | 49.0 |
| Coral Gables: | 13.7 |
| Miami: | 21.7 |
| South Miami: | 15.9 |
| Miami Beach: | 6.6 |
| Pinecrest: | 12.6 |
| West Miami: | 11.6 |
| North Bay Village: | 8.9 |
| Palmetto Bay: | 9.5 |
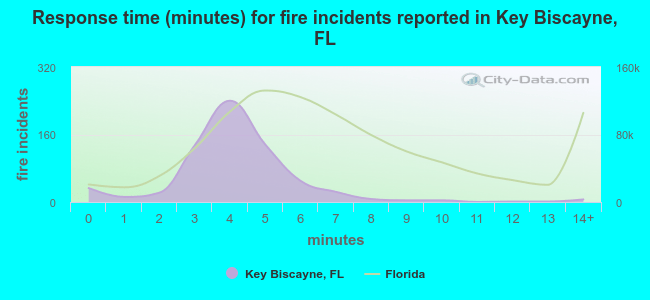 The median response time based on all reported fire incidents is 4 minutes. This is lower compared to the Florida median value.
The median response time in Key Biscayne, FL compared to nearest cities:
(Note: Based on data for all years, including only cities with at least 500 fire incidents)
| Key Biscayne: | 4 minutes |
| Coral Gables: | 5 minutes |
| Miami: | 5 minutes |
| Cutler Bay: | 6 minutes |
| North Miami: | 6 minutes |
| Hialeah: | 7 minutes |
| Doral: | 6 minutes |
| North Miami Beach: | 6 minutes |
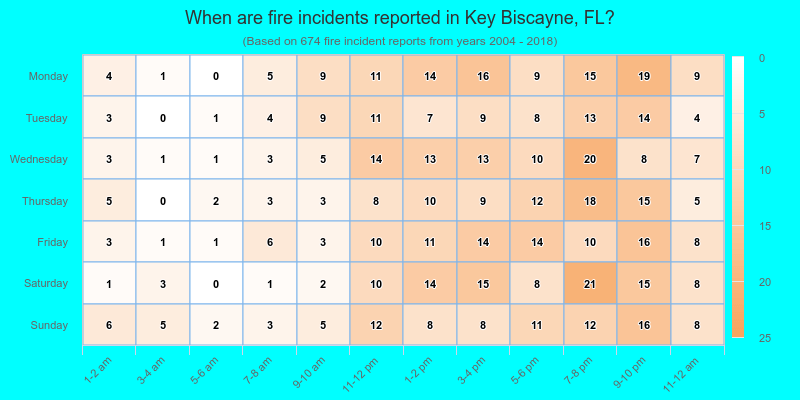
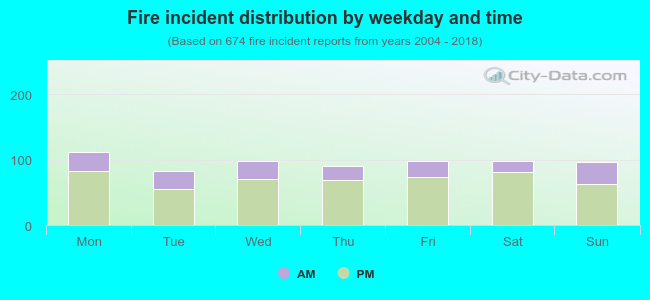 26.7% incidents where reported in the morning and 73.3% in the evening. The most fires (16.6%) took place on Monday, and the least (12.3%) on Tuesday.
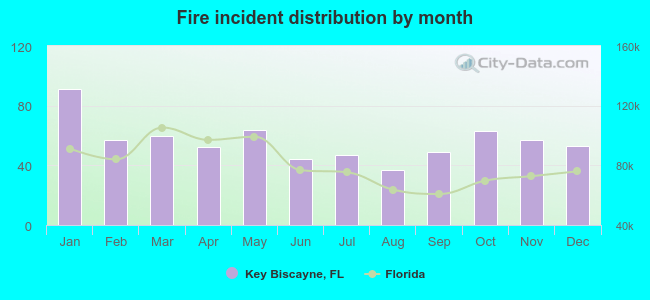 Based on the 674 fires from years 2004 - 2018 most fires (13.5%) took place during January, and the least (5.5%) in August.
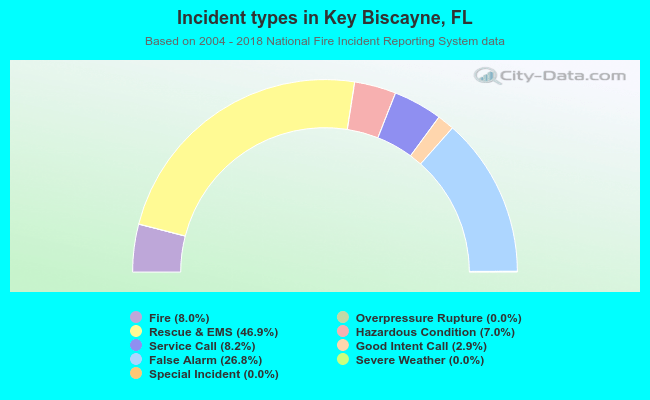 Out of all 8,392 cases reported during the years 2004 - 2018, the most belonged to the categories: Rescue & EMS (46.9%), False Alarm (26.8%), and Service Call (8.2%).
 When looking into fire subcategories, the most reports belonged to: Structure Fires (61.6%), and Outside Fires (24.0%).