Laie: Fire Incidents, Hawaii (HI)
Where are fire incidents reported in Laie, HI
Something went wrong! Please refresh the page.
|
| |||||||||||||||||||||||||||||||||||||||||||||||||||||
2003 - 2018 National Fire Incident Reporting System (NFIRS) incidents
- Incident types reported to NFIRS in Laie, HI
- 47539.8%Rescue & EMS
- 18415.4%Hazardous Condition
- 18115.2%Fire
- 16113.5%Good Intent Call
- 13611.4%Service Call
- 554.6%False Alarm
- Fire incident types reported to NFIRS in Laie, HI
- 11563.5%Outside Fires
- 4927.1%Structure Fires
- 179.4%Mobile Property/Vehicle Fires
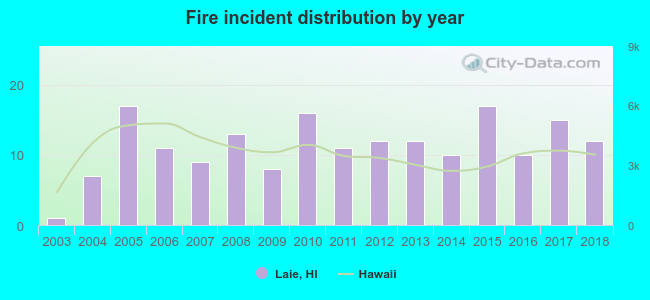 According to the data from the years 2003 - 2018 the average number of fires per year is 11. The highest number of reported fires - 17 took place in 2005, and the least - 1 in 2003. The data has a growing trend.
The average number of yearly fire incidents per 10k residents in Laie, HI compared to nearest cities:
(Note: Based on data for the last 3 years, including only cities with population 5,000 and above)
| Laie: | 20.1 |
| Wahiawa: | 36.5 |
| Mililani Town: | 6.3 |
| Waipio: | 11.1 |
| Pearl City: | 13.9 |
| Aiea: | 76.7 |
| Kaneohe: | 17.5 |
| Waipahu: | 36.5 |
| Waianae: | 229.7 |

 31.5% incidents where reported in the morning and 68.5% in the evening. The most fires (17.7%) took place on Friday, and the least (11.6%) on Tuesday.
 Based on the 181 fire incident reports from years 2003 - 2018 most fires (12.7%) took place during August, and the least (5.5%) in February.
 Out of all 1,192 cases reported during the years 2003 - 2018, the most belonged to the categories: Overpressure Rupture (39.8%), Rescue & EMS (15.4%), and Fire (15.2%).
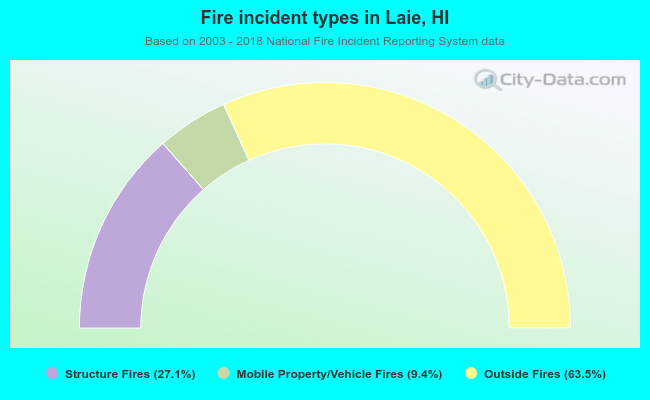 When looking into fire subcategories, the most reports belonged to: Outside Fires (63.5%), and Structure Fires (27.1%).