Largo: Fire Incidents, Florida (FL)
Where are fire incidents reported in Largo, FL
Something went wrong! Please refresh the page.
| Fire incidents reported | |
|---|---|
| Sreet name | Count |
| ULMERTON RD | 778 |
| SEMINOLE BLVD | 446 |
| BELCHER RD | 372 |
| EAST BAY DR | 342 |
| WALSINGHAM RD | 272 |
| STARKEY RD | 246 |
| US 19 HWY | 212 |
| WEST BAY DR | 162 |
| INDIAN ROCKS RD | 156 |
| CLEARWATER LARGO RD | 154 |
| 66 ST | 126 |
| MISSOURI AVE | 114 |
| ROSERY RD | 110 |
| 8 AVE | 106 |
| VONN RD | 104 |
| 142 AVE | 90 |
| 126 AVE | 86 |
| RIDGE RD | 86 |
| LAKE AVE | 82 |
| JASPER ST | 74 |
| 102 AVE | 58 |
| HAMLIN BLVD | 56 |
| EAST BAY DR-LA | 54 |
| 16 AVE | 52 |
| 6 AVE | 50 |
| DONEGAN RD | 48 |
| OAKHURST RD | 46 |
| 134 AVE | 44 |
| ADRIAN AVE | 44 |
| GLADES CIR | 44 |
| Other | 347 |
2005 - 2018 National Fire Incident Reporting System (NFIRS) incidents
- Incident types reported to NFIRS in Largo, FL
- 82,58174.2%Rescue & EMS
- 15,10513.6%Good Intent Call
- 4,9614.5%Fire
- 4,8914.4%Hazardous Condition
- 2,4362.2%False Alarm
- 1,1501.0%Service Call
- Fire incident types reported to NFIRS in Largo, FL
- 2,57852.0%Structure Fires
- 1,42228.7%Outside Fires
- 65013.1%Mobile Property/Vehicle Fires
- 3116.3%Other
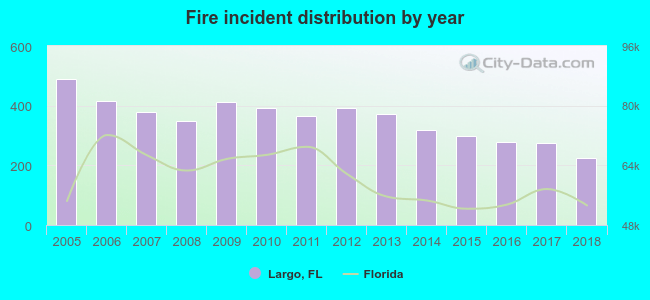 Based on the data from the years 2005 - 2018 the average number of fires per year is 354. The highest number of fires - 489 took place in 2005, and the least - 223 in 2018. The data has a declining trend.
The average number of yearly fire incidents per 10k residents in Largo, FL compared to nearest cities:
(Note: Based on data for the last 3 years, including only cities with population 5,000 and above)
| Largo: | 32.8 |
| Clearwater: | 44.1 |
| Seminole: | 58.6 |
| Pinellas Park: | 38.7 |
| Kenneth City: | 6.6 |
| Dunedin: | 21.9 |
| Safety Harbor: | 19.7 |
| Lealman: | 15.8 |
| Treasure Island: | 29.9 |
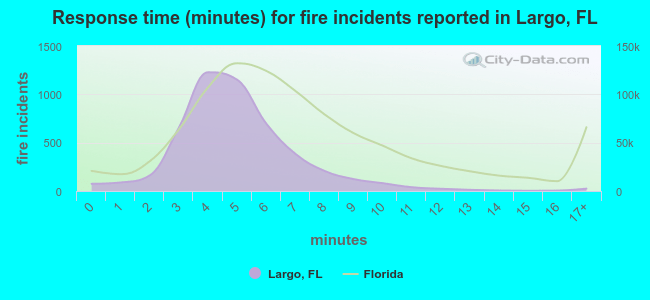 The median response time based on all reported fire incidents is 5 minutes. This is lower than the Florida median value.
The median response time in Largo, FL compared to nearest cities:
(Note: Based on data for all years, including only cities with at least 500 fire incidents)
| Largo: | 5 minutes |
| Clearwater: | 5 minutes |
| Seminole: | 5 minutes |
| Pinellas Park: | 5 minutes |
| Dunedin: | 5 minutes |
| Safety Harbor: | 5 minutes |
| Lealman: | 5 minutes |
| St. Petersburg: | 4 minutes |
| Oldsmar: | 6 minutes |
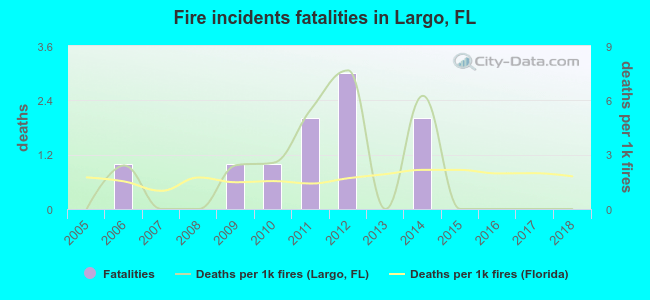 According to the data from the years 2005 - 2018 the average number of fire-related fatalities per year is 1. The highest number of reported deaths - 3 took place in 2012, and the lowest - 0 in 2005. The data has a constant trend.
The average number of deaths per 1,000 fires is 2. This indicator was the highest - 8 in 2012, and the lowest 0 in 2005. The trend for fatalities per 1,000 fires is constant. Compared to the Florida value the number of fatalities per 1,000 fire incidents is similar.
According to the data from the years 2005 - 2018 the average number of fire-related fatalities per year is 1. The highest number of reported deaths - 3 took place in 2012, and the lowest - 0 in 2005. The data has a constant trend.
The average number of deaths per 1,000 fires is 2. This indicator was the highest - 8 in 2012, and the lowest 0 in 2005. The trend for fatalities per 1,000 fires is constant. Compared to the Florida value the number of fatalities per 1,000 fire incidents is similar.Deaths per 1,000 incidents in Largo, FL compared to nearest cities:
(Note: Based on data for all years, including only cities with at least 2,500 fire incidents)
| Largo: | 2.0 |
| Clearwater: | 0.7 |
| Pinellas Park: | 2.3 |
| St. Petersburg: | 0.9 |
| Tampa: | 2.0 |
| New Port Richey: | 2.9 |
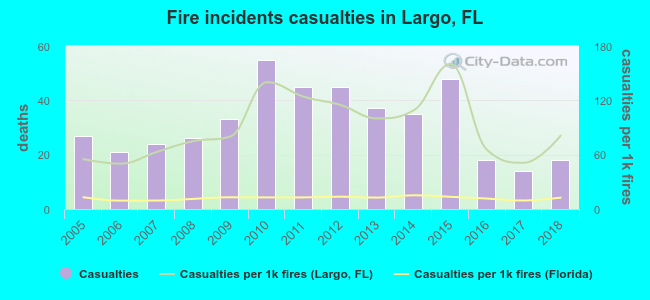 According to the data from the years 2005 - 2018 the average number of fire-related casualties per year is 32. The highest number of casualties - 55 took place in 2010, and the lowest - 14 in 2017. The data has a dropping trend.
The average number of injuries per 1,000 fires is 91. This indicator was the highest - 160 in 2015, and the lowest 50 in 2006. The trend for casualties per 1,000 fires is increasing. Compared to the Florida value the number of casualties per 1,000 fire incidents is much higher.
According to the data from the years 2005 - 2018 the average number of fire-related casualties per year is 32. The highest number of casualties - 55 took place in 2010, and the lowest - 14 in 2017. The data has a dropping trend.
The average number of injuries per 1,000 fires is 91. This indicator was the highest - 160 in 2015, and the lowest 50 in 2006. The trend for casualties per 1,000 fires is increasing. Compared to the Florida value the number of casualties per 1,000 fire incidents is much higher.Casualties per 1,000 incidents in Largo, FL compared to nearest cities:
(Note: Based on data for all years, including only cities with at least 500 fire incidents)
| Largo: | 89.9 |
| Clearwater: | 49.9 |
| Seminole: | 42.7 |
| Pinellas Park: | 48.9 |
| Dunedin: | 55.1 |
| Safety Harbor: | 48.0 |
| Lealman: | 48.5 |
| St. Petersburg: | 24.4 |
| Oldsmar: | 11.4 |
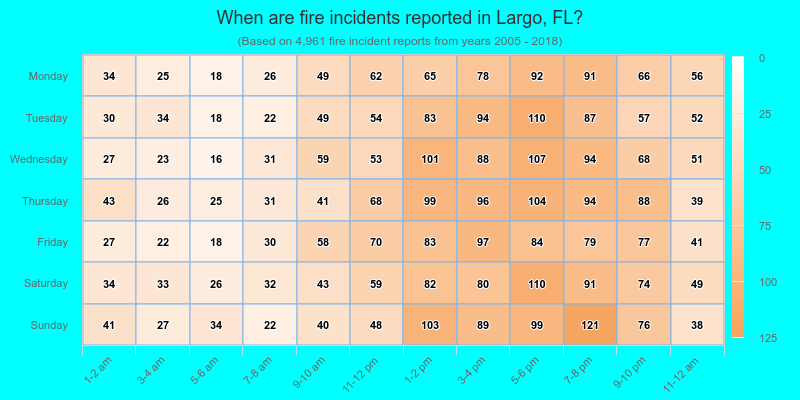
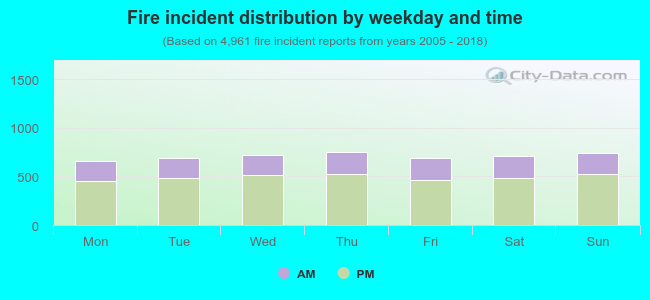 30.8% incidents where reported in the morning and 69.2% in the evening. The most fires (15.2%) took place on Thursday, and the least (13.3%) on Monday.
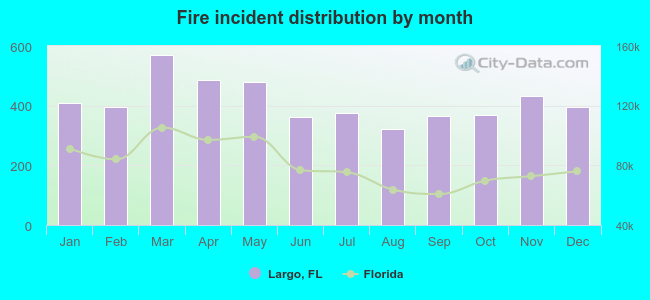 Based on the 4,961 fire incident reports from years 2005 - 2018 most fires (11.5%) took place during March, and the least (6.5%) in August.
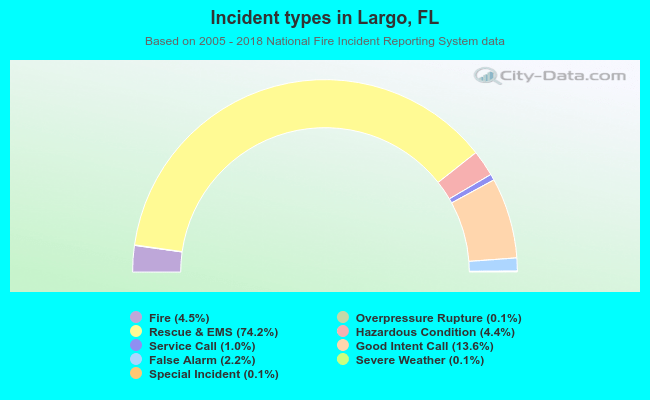 Out of all 111,315 cases reported during the years 2005 - 2018, the most belonged to the categories: Rescue & EMS (74.2%), Good Intent Call (13.6%), and Fire (4.5%).
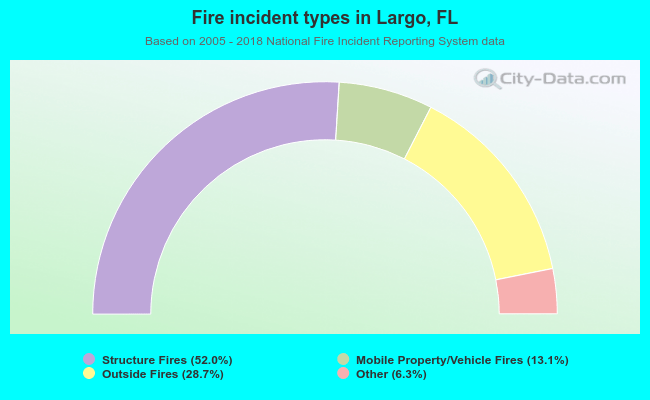 When looking into fire subcategories, the most incidents belonged to: Structure Fires (52.0%), and Outside Fires (28.7%).