Layton: Fire Incidents, Utah (UT)
Where are fire incidents reported in Layton, UT
Something went wrong! Please refresh the page.
| Fire incidents reported | |
|---|---|
| Sreet name | Count |
| MAIN ST | 316 |
| HILL FIELD RD | 142 |
| GENTILE ST | 134 |
| FAIRFIELD RD | 130 |
| HILL FLD | 130 |
| ANTELOPE DR | 124 |
| HWY 193 | 88 |
| FORT LN | 84 |
| GORDON AVE | 84 |
| CHURCH ST | 52 |
| ANGEL ST | 48 |
| 1425 N | 46 |
| WASATCH DR | 40 |
| AVALON DR | 32 |
| I15 NB | 32 |
| CHERRY LN | 28 |
| HWY 89 | 28 |
| SUNSET DR | 28 |
| 2200 | 22 |
| 2200 W | 20 |
| HILLFIELD RD | 20 |
| 1650 N | 18 |
| 193 HWY | 18 |
| 2175 E | 18 |
| COLONIAL AVE | 18 |
| GENTILE | 18 |
| 1600 N | 16 |
| CANYON VIEW DR | 16 |
| DAWSON ST | 16 |
| DIXIE AVE | 16 |
| Other | 302 |
2002 - 2018 National Fire Incident Reporting System (NFIRS) incidents
- Incident types reported to NFIRS in Layton, UT
- 21,08273.2%Rescue & EMS
- 2,0847.2%Fire
- 1,7236.0%False Alarm
- 1,7055.9%Hazardous Condition
- 1,2124.2%Good Intent Call
- 9763.4%Service Call
- Fire incident types reported to NFIRS in Layton, UT
- 87241.8%Structure Fires
- 71434.3%Outside Fires
- 39819.1%Mobile Property/Vehicle Fires
- 1004.8%Other
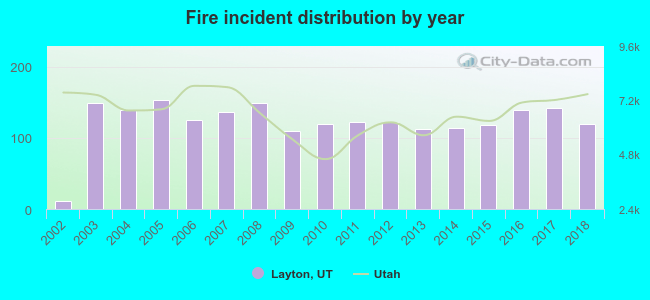 According to the data from the years 2002 - 2018 the average number of fires per year is 123. The highest number of fire incidents - 153 took place in 2005, and the least - 11 in 2002. The data has a rising trend.
The average number of yearly fire incidents per 10k residents in Layton, UT compared to nearest cities:
(Note: Based on data for the last 3 years, including only cities with population 5,000 and above)
| Layton: | 18.6 |
| Kaysville: | 17.5 |
| South Weber: | 12.4 |
| Clearfield: | 29.2 |
| Fruit Heights: | 25.6 |
| Syracuse: | 10.4 |
| Sunset: | 30.4 |
| Washington Terrace: | 1.1 |
| Clinton: | 20.5 |
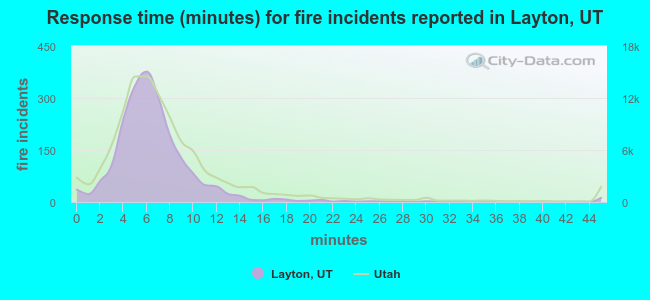 The median response time based on all reported fire incidents is 6 minutes. This is about the same as the Utah median value.
The median response time in Layton, UT compared to nearest cities:
(Note: Based on data for all years, including only cities with at least 500 fire incidents)
| Layton: | 6 minutes |
| Kaysville: | 6 minutes |
| Clearfield: | 6 minutes |
| Syracuse: | 6 minutes |
| Farmington: | 7 minutes |
| Riverdale: | 6 minutes |
| Roy: | 6 minutes |
| West Haven: | 7 minutes |
| Ogden: | 6 minutes |
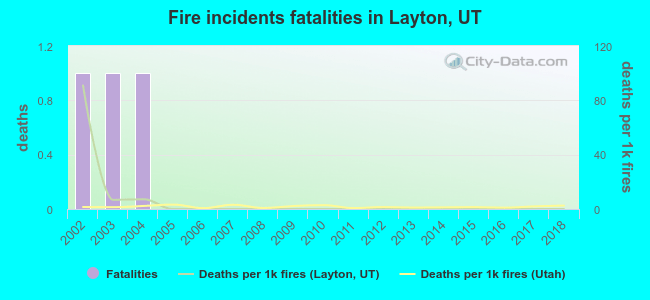 Based on the data from the years 2002 - 2018 the average number of fire-related yearly deaths is 0. The highest number of reported deaths - 1 took place in 2002, and the lowest - 0 in 2005. The data has a declining trend.
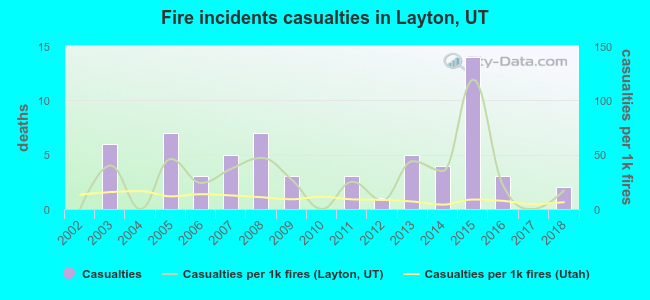 Based on the reports from the years 2002 - 2018 the average number of fire-related casualties per year is 4. The highest number of injuries - 14 took place in 2015, and the lowest - 0 in 2002. The data has a growing trend.
The average number of casualties per 1,000 fires is 29. This indicator was the highest - 119 in 2015, and the lowest 0 in 2002. The trend for casualties per 1,000 fire incidents is rising. Compared to the state value the number of injuries per 1,000 fire incidents is much higher.
Based on the reports from the years 2002 - 2018 the average number of fire-related casualties per year is 4. The highest number of injuries - 14 took place in 2015, and the lowest - 0 in 2002. The data has a growing trend.
The average number of casualties per 1,000 fires is 29. This indicator was the highest - 119 in 2015, and the lowest 0 in 2002. The trend for casualties per 1,000 fire incidents is rising. Compared to the state value the number of injuries per 1,000 fire incidents is much higher.Casualties per 1,000 incidents in Layton, UT compared to nearest cities:
(Note: Based on data for all years, including only cities with at least 500 fire incidents)
| Layton: | 30.2 |
| Kaysville: | 21.2 |
| Clearfield: | 23.0 |
| Syracuse: | 1.5 |
| Farmington: | 1.7 |
| Riverdale: | 0.0 |
| Roy: | 7.4 |
| West Haven: | 6.0 |
| Ogden: | 16.9 |
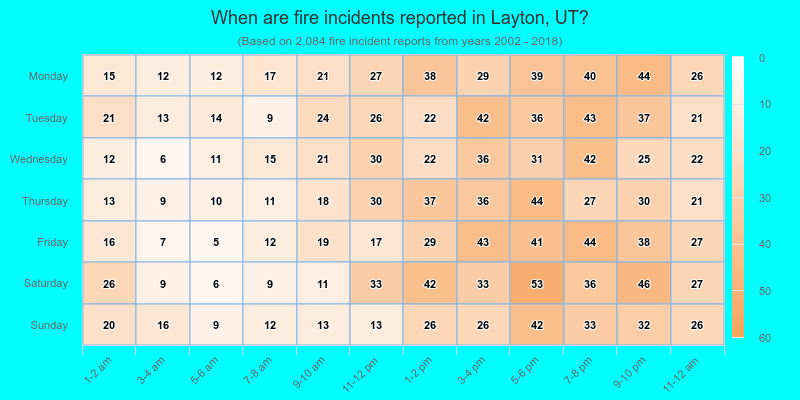
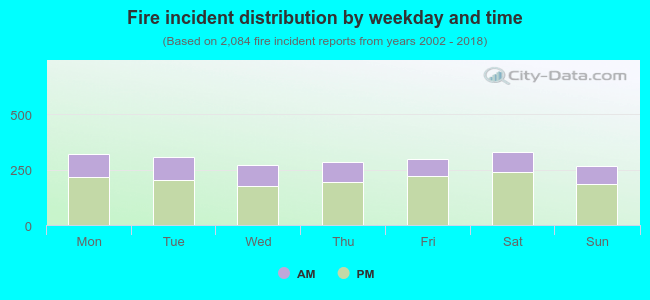 31.2% incidents where reported in the morning and 68.8% in the evening. The most fires (15.9%) took place on Saturday, and the least (12.9%) on Sunday.
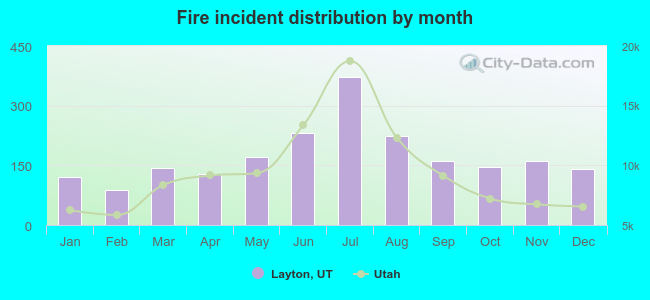 Based on the 2,084 fire incidents from years 2002 - 2018 most fires (17.9%) took place during July, and the least (4.2%) in February.
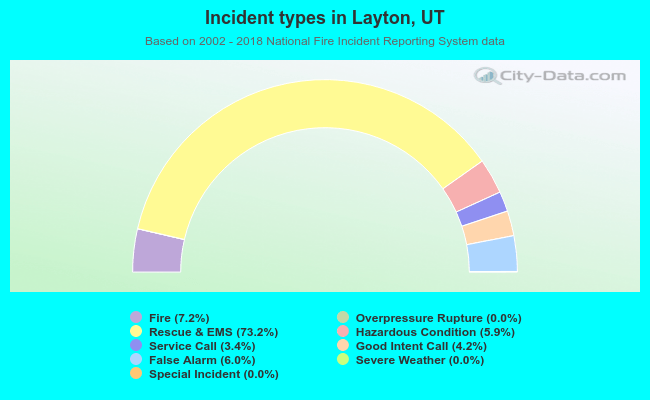 Out of all 28,802 cases reported during the years 2002 - 2018, the most belonged to the categories: Rescue & EMS (73.2%), Fire (7.2%), and False Alarm (6.0%).
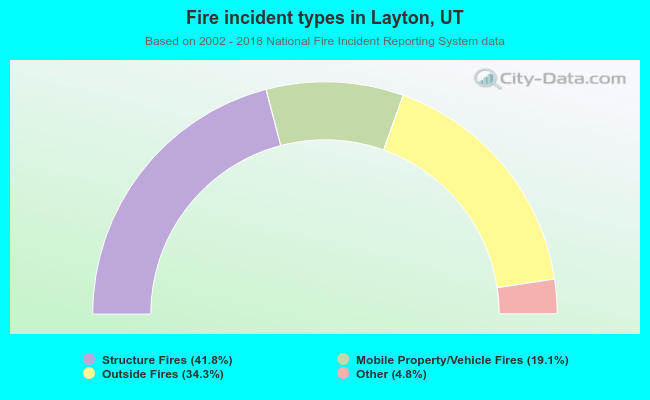 When looking into fire subcategories, the most incidents belonged to: Structure Fires (41.8%), and Outside Fires (34.3%).