Lennox: Fire Incidents, California (CA)
Where are fire incidents reported in Lennox, CA
Something went wrong! Please refresh the page.
|
| |||||||||||||||||||||||||||||||||||||||||||||||||||||||||||||||||||||||||||||||||||||||||||||||||||||
2005 - 2018 National Fire Incident Reporting System (NFIRS) incidents
- Incident types reported to NFIRS in Lennox, CA
- 3,49969.4%Rescue & EMS
- 74414.8%Good Intent Call
- 3106.2%Fire
- 2324.6%False Alarm
- 1422.8%Hazardous Condition
- 981.9%Service Call
- 90.2%Special Incident
- Fire incident types reported to NFIRS in Lennox, CA
- 12440.0%Outside Fires
- 7825.2%Structure Fires
- 6521.0%Mobile Property/Vehicle Fires
- 4313.9%Other
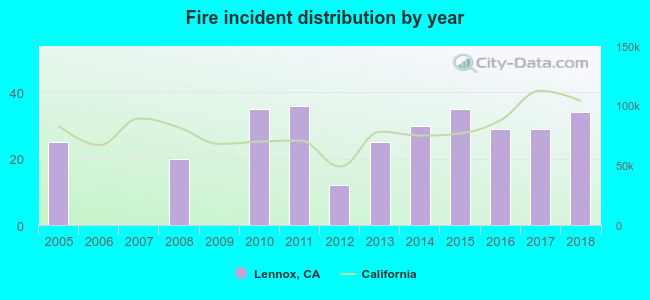 According to the data from the years 2005 - 2018 the average number of fires per year is 22. The highest number of fire incidents - 36 took place in 2011, and the least - 0 in 2006. The data has a growing trend.
The average number of yearly fire incidents per 10k residents in Lennox, CA compared to nearest cities:
(Note: Based on data for the last 3 years, including only cities with population 5,000 and above)
| Lennox: | 13.5 |
| Inglewood: | 23.8 |
| Hawthorne: | 18.5 |
| El Segundo: | 31.3 |
| Ladera Heights: | 17.4 |
| Lawndale: | 14.3 |
| Gardena: | 27.7 |
| Manhattan Beach: | 13.8 |
| Culver City: | 17.9 |

 40.0% incidents where reported in the morning and 60.0% in the evening. The most fires (19.7%) took place on Sunday, and the least (11.9%) on Thursday.
 Based on the 310 fire incidents from years 2005 - 2018 most fires (19.7%) took place during January, and the least (5.2%) in August.
 Out of all 5,040 cases reported during the years 2005 - 2018, the most belonged to the categories: Rescue & EMS (69.4%), Good Intent Call (14.8%), and Fire (6.2%).
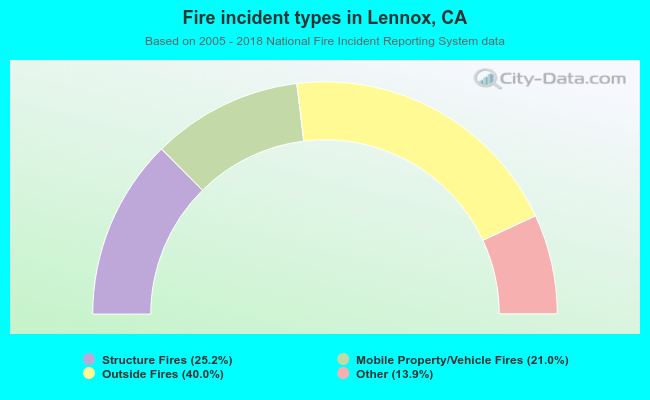 When looking into fire subcategories, the most reports belonged to: Outside Fires (40.0%), and Structure Fires (25.2%).