Lewisville: Fire Incidents, North Carolina (NC)
Where are fire incidents reported in Lewisville, NC
Something went wrong! Please refresh the page.
| Fire incidents reported | |
|---|---|
| Sreet name | Count |
| SHALLOWFORD RD | 202 |
| WILLIAMS RD | 74 |
| CONRAD RD | 42 |
| BIG TREE DR | 30 |
| BROOKWAY WEST DR | 28 |
| MISTY CREEK RD | 28 |
| SHALLOWFORD 5776-7499 RD | 28 |
| GRAPEVINE RD | 26 |
| LAGRANDE PLACE DR | 26 |
| LEWISVILLE-CLEMMONS RD | 26 |
| HAUSER RD | 24 |
| STYERS FERRY RD | 24 |
| LEWISVILLE CLEMMONS RD | 22 |
| LEWISVILLE-CLEM 331-1399 RD | 22 |
| SEQUOIA DR | 22 |
| SHALLOWFORD 7500-8199 RD | 22 |
| HAUSER 400-2100 RD | 20 |
| KETNER RD | 18 |
| LEWISVILLECLEM 3311399 RD | 18 |
| REYNOLDS RD | 18 |
| FRANKLIN RD | 16 |
| LEWISVILLEVIENNA RD | 16 |
| PINEHURST DR | 16 |
| PLEMMONS RD | 16 |
| SCOTT RD | 16 |
| SHALLOWFORD 6300-6749 RD | 16 |
| SONATA DR | 16 |
| CRENATA DR | 14 |
| DEVEROW CT | 14 |
| LEWISVILLE-VIENNA RD | 14 |
| Other | 384 |
2002 - 2018 National Fire Incident Reporting System (NFIRS) incidents
- Incident types reported to NFIRS in Lewisville, NC
- 1,83931.5%Rescue & EMS
- 1,25821.5%Fire
- 86914.9%Good Intent Call
- 77313.2%Hazardous Condition
- 61010.4%Service Call
- 4828.2%False Alarm
- 60.1%Severe Weather
- Fire incident types reported to NFIRS in Lewisville, NC
- 44835.6%Structure Fires
- 38230.4%Other
- 32726.0%Outside Fires
- 1018.0%Mobile Property/Vehicle Fires
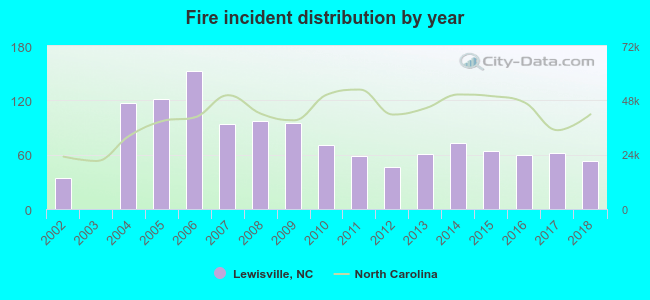 Based on the data from the years 2002 - 2018 the average number of fire incidents per year is 74. The highest number of reported fires - 152 took place in 2006, and the least - 0 in 2003. The data has a growing trend.
The average number of yearly fire incidents per 10k residents in Lewisville, NC compared to nearest cities:
(Note: Based on data for the last 3 years, including only cities with population 5,000 and above)
| Lewisville: | 43.7 |
| Clemmons: | 41.7 |
| King: | 177.6 |
| Mocksville: | 327.2 |
| Kernersville: | 86.2 |
| Lexington: | 172.1 |
| Thomasville: | 78.8 |
| Oak Ridge: | 30.8 |
| High Point: | 21.2 |
 The median response time based on all reported fire incidents is 7 minutes. This is about the same as the North Carolina median value.
The median response time in Lewisville, NC compared to nearest cities:
(Note: Based on data for all years, including only cities with at least 500 fire incidents)
| Lewisville: | 7 minutes |
| Clemmons: | 7 minutes |
| Winston-Salem: | 4 minutes |
| East Bend: | 7 minutes |
| Advance: | 7 minutes |
| Rural Hall: | 8 minutes |
| King: | 8 minutes |
| Yadkinville: | 8 minutes |
| Walkertown: | 7 minutes |
 Based on the reports from the years 2002 - 2018 the average number of fire-related casualties per year is 0. The highest number of reported casualties - 2 took place in 2005, and the lowest - 0 in 2002. The data has a rising trend.
The average number of casualties per 1,000 fires is 6. This indicator was the highest - 31 in 2015, and the lowest 0 in 2002. The trend for casualties per 1,000 fires is growing. Compared to the North Carolina value the number of casualties per 1,000 fires is about the same.
Based on the reports from the years 2002 - 2018 the average number of fire-related casualties per year is 0. The highest number of reported casualties - 2 took place in 2005, and the lowest - 0 in 2002. The data has a rising trend.
The average number of casualties per 1,000 fires is 6. This indicator was the highest - 31 in 2015, and the lowest 0 in 2002. The trend for casualties per 1,000 fires is growing. Compared to the North Carolina value the number of casualties per 1,000 fires is about the same.Casualties per 1,000 incidents in Lewisville, NC compared to nearest cities:
(Note: Based on data for all years, including only cities with at least 500 fire incidents)
| Lewisville: | 5.6 |
| Clemmons: | 19.2 |
| Winston-Salem: | 14.9 |
| East Bend: | 2.5 |
| Advance: | 8.9 |
| Rural Hall: | 7.0 |
| King: | 9.7 |
| Yadkinville: | 3.1 |
| Walkertown: | 5.9 |
 30.0% incidents where reported in the morning and 70.0% in the evening. The most fires (18.6%) took place on Monday, and the least (12.0%) on Tuesday.
 Based on the 1,258 fire incident reports from years 2002 - 2018 most fires (13.1%) took place during March, and the least (4.7%) in September.
 Out of all 5,844 cases reported during the years 2002 - 2018, the most belonged to the categories: Rescue & EMS (31.5%), Fire (21.5%), and Good Intent Call (14.9%).
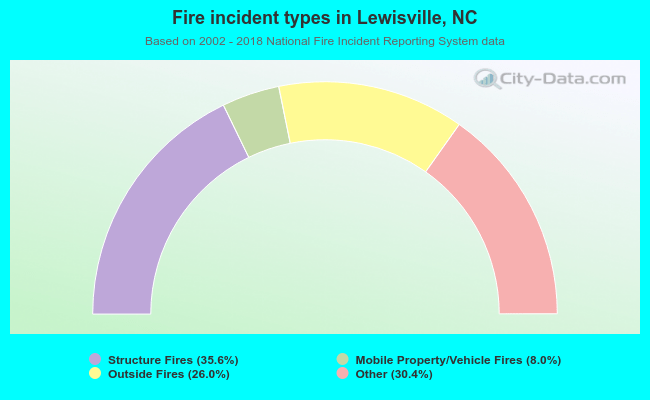 When looking into fire subcategories, the most reports belonged to: Structure Fires (35.6%), and Other (30.4%).