Lincoln: Fire Incidents, Illinois (IL)
Where are fire incidents reported in Lincoln, IL
Something went wrong! Please refresh the page.
| Fire incidents reported | |
|---|---|
| Sreet name | Count |
| KICKAPOO ST | 214 |
| WOODLAWN RD | 180 |
| COLLEGE ST | 124 |
| SHERMAN ST | 90 |
| I-55 | 86 |
| 5TH ST | 76 |
| 7TH ST | 72 |
| STATE ST | 68 |
| MADISON ST | 66 |
| I55 | 62 |
| KEOKUK ST | 60 |
| 4TH ST | 56 |
| BROADWAY ST | 52 |
| CENTENNIAL CT | 52 |
| PULASKI ST | 48 |
| CHICAGO ST | 46 |
| MCLEAN ST | 46 |
| POSTVILLE DR | 46 |
| I55 HWY | 44 |
| JEFFERSON ST | 44 |
| SANGAMON ST | 44 |
| 1700TH ST | 42 |
| 6TH ST | 40 |
| DELAVAN ST | 40 |
| KANKAKEE ST | 40 |
| PEKIN ST | 40 |
| SEVENTH ST | 40 |
| ELM ST | 38 |
| 1500TH ST | 36 |
| LOGAN ST | 36 |
| Other | 182 |
2002 - 2018 National Fire Incident Reporting System (NFIRS) incidents
- Incident types reported to NFIRS in Lincoln, IL
- 9,85155.0%Rescue & EMS
- 2,11011.8%Fire
- 1,7489.8%Service Call
- 1,5168.5%Good Intent Call
- 1,4348.0%Hazardous Condition
- 1,1116.2%False Alarm
- 590.3%Overpressure Rupture
- 400.2%Severe Weather
- 270.2%Special Incident
- Fire incident types reported to NFIRS in Lincoln, IL
- 92143.6%Structure Fires
- 74435.3%Outside Fires
- 36517.3%Mobile Property/Vehicle Fires
- 803.8%Other
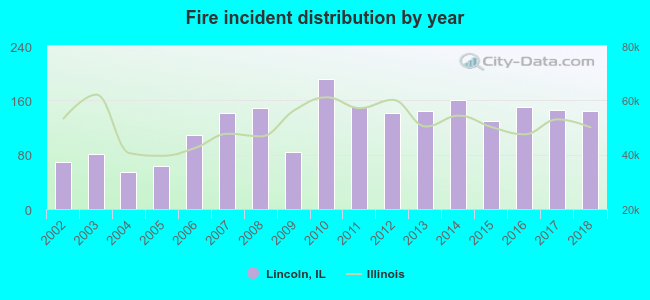 According to the data from the years 2002 - 2018 the average number of fires per year is 124. The highest number of fires - 191 took place in 2010, and the least - 54 in 2004. The data has a growing trend.
The average number of yearly fire incidents per 10k residents in Lincoln, IL compared to nearest cities:
(Note: Based on data for the last 3 years, including only cities with population 5,000 and above)
| Lincoln: | 103.6 |
| Clinton: | 133.3 |
| Springfield: | 46.5 |
| Bloomington: | 28.6 |
| Decatur: | 53.1 |
| Normal: | 12.2 |
| Pekin: | 53.8 |
| Morton: | 18.6 |
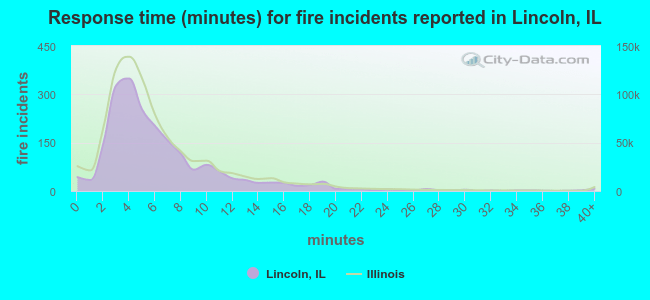 The median response time based on all reported fire incidents is 5 minutes. This is comparable to the Illinois median value.
The median response time in Lincoln, IL compared to nearest cities:
(Note: Based on data for all years, including only cities with at least 500 fire incidents)
| Lincoln: | 5 minutes |
| Clinton: | 8 minutes |
| Sherman: | 9 minutes |
| Petersburg: | 9 minutes |
| Springfield: | 5 minutes |
| Bloomington: | 5 minutes |
| Decatur: | 5 minutes |
| Normal: | 5 minutes |
| Pekin: | 4 minutes |
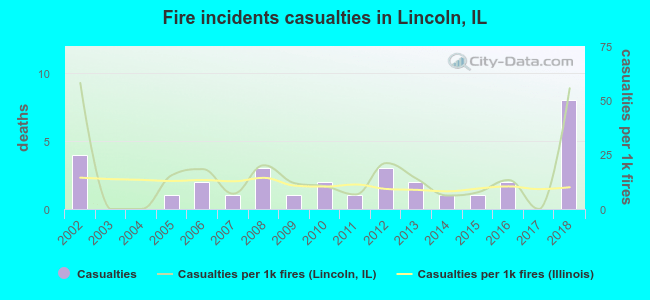 Based on the data from the years 2002 - 2018 the average number of fire-related yearly casualties is 2. The highest number of reported injuries - 8 took place in 2018, and the lowest - 0 in 2003. The data has an increasing trend.
The average number of injuries per 1,000 fires is 16. This indicator was the highest - 58 in 2002, and the lowest 0 in 2003. The trend for injuries per 1,000 fires is declining. Compared to the state value the number of injuries per 1,000 fire incidents is higher.
Based on the data from the years 2002 - 2018 the average number of fire-related yearly casualties is 2. The highest number of reported injuries - 8 took place in 2018, and the lowest - 0 in 2003. The data has an increasing trend.
The average number of injuries per 1,000 fires is 16. This indicator was the highest - 58 in 2002, and the lowest 0 in 2003. The trend for injuries per 1,000 fires is declining. Compared to the state value the number of injuries per 1,000 fire incidents is higher.Casualties per 1,000 incidents in Lincoln, IL compared to nearest cities:
(Note: Based on data for all years, including only cities with at least 500 fire incidents)
| Lincoln: | 15.2 |
| Clinton: | 5.0 |
| Sherman: | 5.8 |
| Petersburg: | 0.0 |
| Springfield: | 17.9 |
| Bloomington: | 20.8 |
| Decatur: | 34.3 |
| Normal: | 10.7 |
| Pekin: | 21.5 |
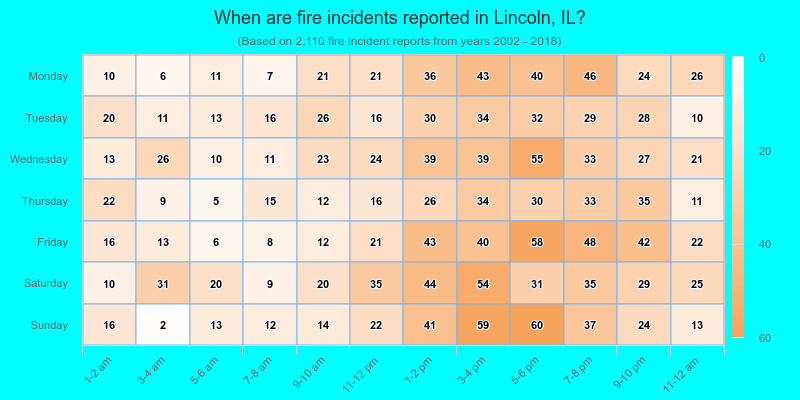
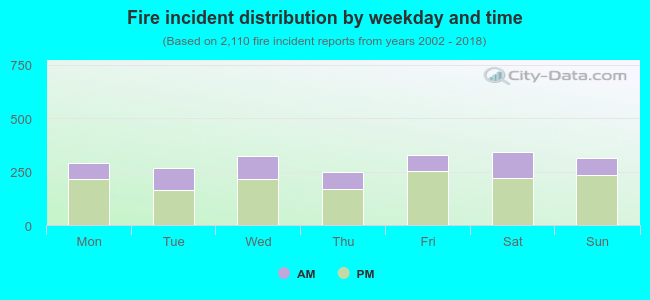 30.5% incidents where reported in the morning and 69.5% in the evening. The most fires (16.3%) took place on Saturday, and the least (11.8%) on Thursday.
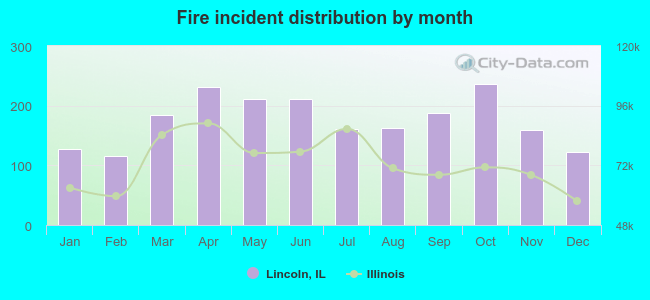 According to the 2,110 incident reports from years 2002 - 2018 most fires (11.2%) took place during October, and the least (5.5%) in February.
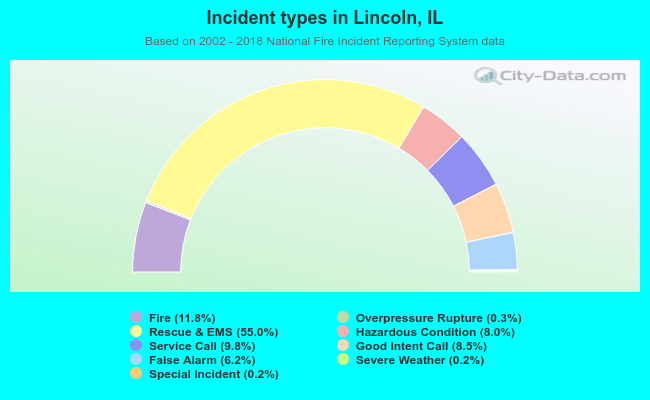 Out of all 17,896 cases reported during the years 2002 - 2018, the most belonged to the categories: Rescue & EMS (55.0%), Fire (11.8%), and Service Call (9.8%).
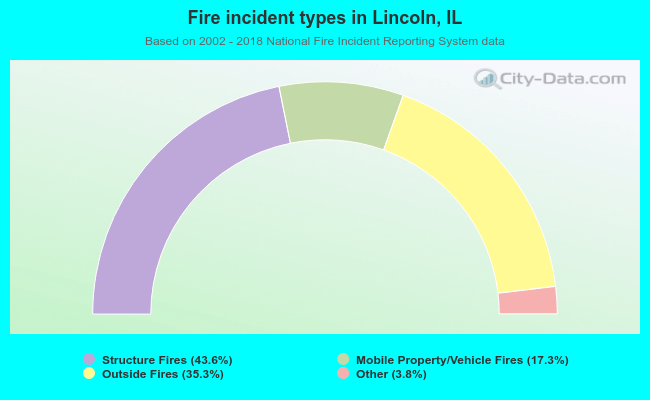 When looking into fire subcategories, the most reports belonged to: Structure Fires (43.6%), and Outside Fires (35.3%).