Litchfield: Fire Incidents, Connecticut (CT)
Where are fire incidents reported in Litchfield, CT
Something went wrong! Please refresh the page.
|
| |||||||||||||||||||||||||||||||||||||||||||||||||||||||||||||||||||||||||||||||||||||||||||||||||||||||||||||
2002 - 2018 National Fire Incident Reporting System (NFIRS) incidents
- Incident types reported to NFIRS in Litchfield, CT
- 62224.6%False Alarm
- 52020.6%Good Intent Call
- 47919.0%Hazardous Condition
- 40816.2%Rescue & EMS
- 33013.1%Fire
- 1556.1%Service Call
- 60.2%Severe Weather
- 30.1%Overpressure Rupture
- 30.1%Special Incident
- Fire incident types reported to NFIRS in Litchfield, CT
- 21364.5%Structure Fires
- 6519.7%Outside Fires
- 4112.4%Mobile Property/Vehicle Fires
- 113.3%Other
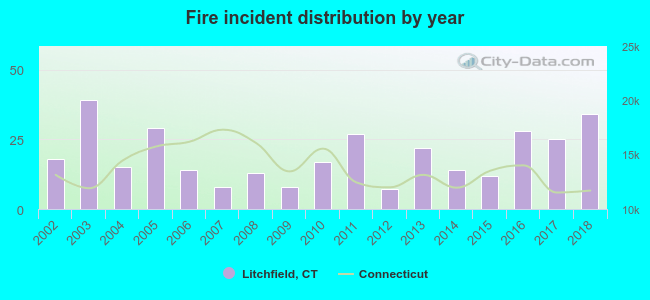 According to the data from the years 2002 - 2018 the average number of fires per year is 19. The highest number of reported fire incidents - 39 took place in 2003, and the least - 7 in 2012. The data has a growing trend.
 Based on the data from the years 2002 - 2018 the average number of fire-related yearly casualties is 0. The highest number of injuries - 1 took place in 2013, and the lowest - 0 in 2002. The data has a constant trend.
 27.6% incidents where reported in the morning and 72.4% in the evening. The most fires (17.6%) took place on Sunday, and the least (12.1%) on Wednesday.
 According to the 330 reports from years 2002 - 2018 most fires (13.6%) took place during January, and the least (4.2%) in August.
 Out of all 2,526 cases reported during the years 2002 - 2018, the most belonged to the categories: False Alarm (24.6%), Good Intent Call (20.6%), and Hazardous Condition (19.0%).
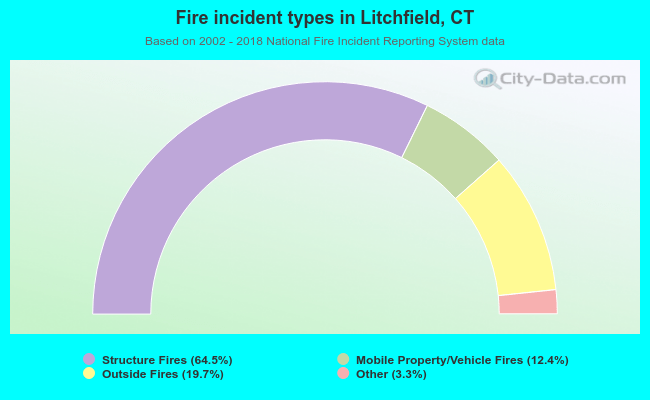 When looking into fire subcategories, the most incidents belonged to: Structure Fires (64.5%), and Outside Fires (19.7%).