| Fire incidents reported |
|---|
| Sreet name | Count |
|---|
| COLUMBUS ST | 34 | | LITHOPOLIS RD | 26 | | SMITH RD | 12 | | FAULKNER DR | 10 | | PERRILL RD | 10 | | PICKERINGTON RD | 10 | | SOUTH ST | 10 | | ALSPACH RD | 8 | | COONPATH RD | 8 | | MARCY RD | 8 | | WINCHESTERSOUTHERN RD | 8 | | CEDAR HILL RD | 6 | | CHERRY HILL CT | 6 | | LITHOPOLIS-WINCHESTER RD | 6 | | MASON RD | 6 | | NORTH ST | 6 | | SALINGER DR | 6 | | WALNUT ST | 6 | | WINCHESTER-SOUTHERN RD | 6 | | AMANDA-NORTHERN RD | 4 | | AMANDANORTHERN RD | 4 | | COLUMBUS-LANCASTER RD | 4 | | DELAWARE ST | 4 | | ELDER | 4 | | ELDER LA | 4 |
| | | Fire incidents reported |
|---|
| Sreet name | Count |
|---|
| GROVEPORT RD | 4 | | LITHOPOLISBLOOM RD | 4 | | POE AVE | 4 | | ROYALTON RD | 4 | | SALEM CHURCH RD | 4 | | SLOUGH RD | 4 | | TIMOTHY LANE | 4 | | WASHINGTON ST | 4 | | WILSON RD | 4 | | WINCHESTER SOUTHERN RD | 4 | | 33 | 2 | | ALSPAUGH RD | 2 | | AMANDA NORTHERN RD RD | 2 | | AUDUBON BL | 2 | | BLOOMWOOD DR | 2 | | BOWEN RD | 2 | | BOWLING GREEN LANE | 2 | | CARROLL NORTHERN RD | 2 | | CARROLLSOUTHERN RD | 2 | | CHERRY ALLEY | 2 | | COLUMBUS LANCASTER RD | 2 | | E SOUTH ST | 2 | | ELDER LANE | 2 | | ELM ST | 2 | | |
|
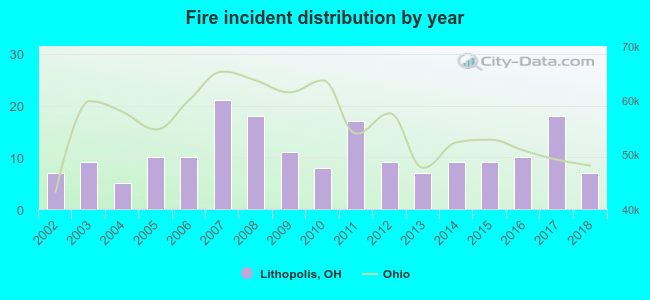 Based on the data from the years 2002 - 2018 the average number of fire incidents per year is 11. The highest number of fire incidents - 21 took place in 2007, and the least - 5 in 2004. The data has a constant trend.
 33.0% incidents where reported in the morning and 67.0% in the evening. The most fires (24.9%) took place on Tuesday, and the least (8.6%) on Friday.
 Based on the 185 incident reports from years 2002 - 2018 most fires (13.0%) took place during March, and the least (4.3%) in May.
 Out of all 589 cases reported during the years 2002 - 2018, the most belonged to the categories: Fire (31.4%), Good Intent Call (20.2%), and Rescue & EMS (14.9%).
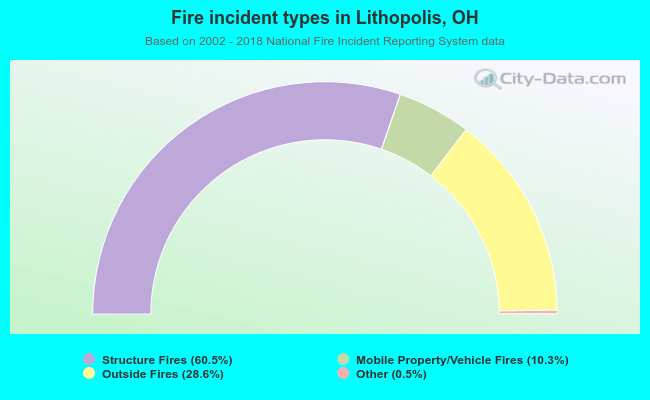 When looking into fire subcategories, the most incidents belonged to: Structure Fires (60.5%), and Outside Fires (28.6%).