Lomira: Fire Incidents, Wisconsin (WI)
Where are fire incidents reported in Lomira, WI
Something went wrong! Please refresh the page.
|
| |||||||||||||||||||||||||||||||||||||||||||||||||||||||||||||||||||||||||||||||||||||||||||||||||||||||||||||
| Other | 23 | |||||||||||||||||||||||||||||||||||||||||||||||||||||||||||||||||||||||||||||||||||||||||||||||||||||||||||||
2003 - 2018 National Fire Incident Reporting System (NFIRS) incidents
- Incident types reported to NFIRS in Lomira, WI
- 68460.6%Rescue & EMS
- 23120.5%Fire
- 837.4%Good Intent Call
- 514.5%Hazardous Condition
- 383.4%Service Call
- 373.3%False Alarm
- 30.3%Severe Weather
- Fire incident types reported to NFIRS in Lomira, WI
- 12554.1%Structure Fires
- 5925.5%Outside Fires
- 4218.2%Mobile Property/Vehicle Fires
- 52.2%Other
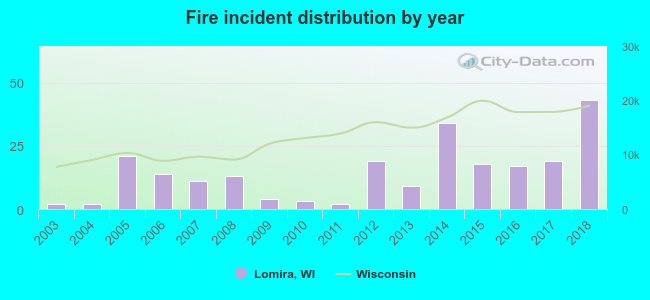 According to the data from the years 2003 - 2018 the average number of fires per year is 14. The highest number of reported fire incidents - 43 took place in 2018, and the least - 2 in 2003. The data has an increasing trend.
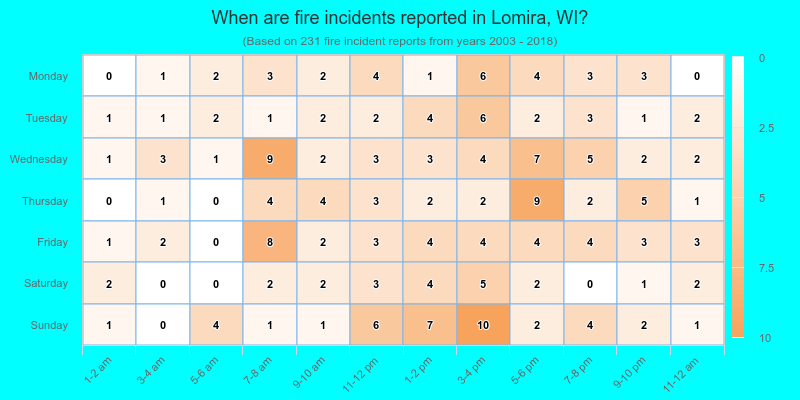
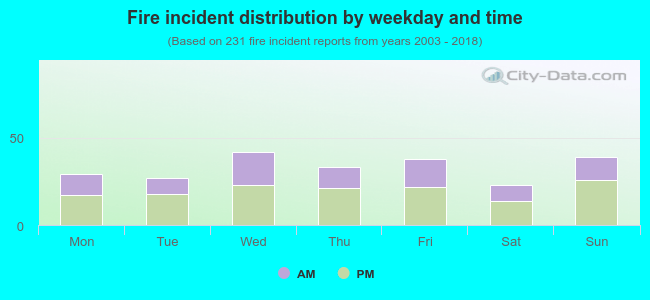 39.0% incidents where reported in the morning and 61.0% in the evening. The most fires (18.2%) took place on Wednesday, and the least (10.0%) on Saturday.
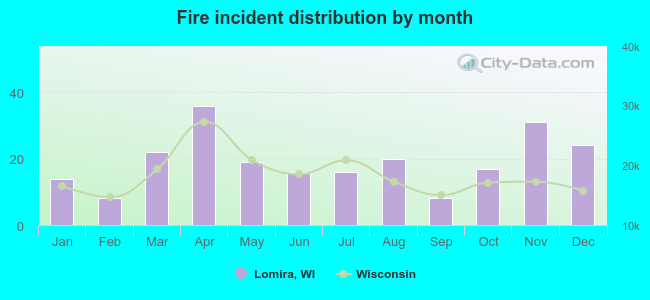 According to the 231 fire incidents from years 2003 - 2018 most fires (15.6%) took place during April, and the least (3.5%) in February.
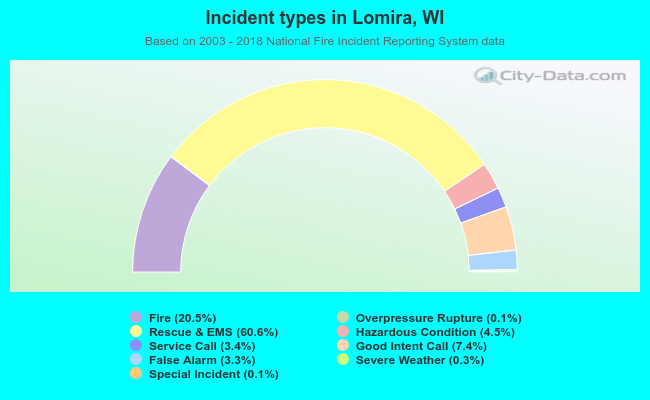 Out of all 1,129 cases reported during the years 2003 - 2018, the most belonged to the categories: Rescue & EMS (60.6%), Fire (20.5%), and Good Intent Call (7.4%).
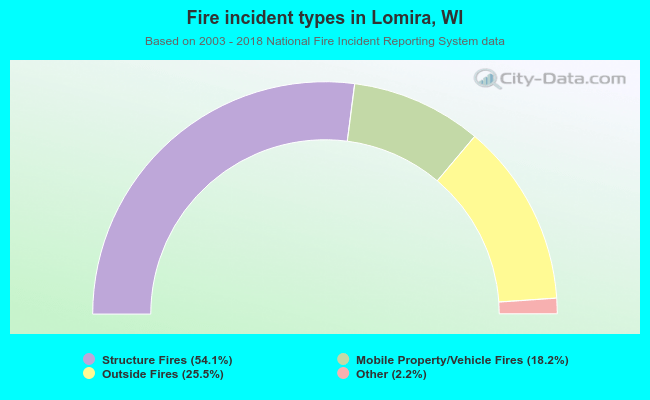 When looking into fire subcategories, the most incidents belonged to: Structure Fires (54.1%), and Outside Fires (25.5%).