Lost Hills: Fire Incidents, California (CA)
Where are fire incidents reported in Lost Hills, CA
Something went wrong! Please refresh the page.
|
| |||||||||||||||||||||||||||||||||||||||||||||||||||||||||||||||||||||||||||||||||||||||||||||||||||||||||||||
| Other | 11 | |||||||||||||||||||||||||||||||||||||||||||||||||||||||||||||||||||||||||||||||||||||||||||||||||||||||||||||
2002 - 2018 National Fire Incident Reporting System (NFIRS) incidents
- Incident types reported to NFIRS in Lost Hills, CA
- 95749.6%Rescue & EMS
- 48525.1%Fire
- 25113.0%Good Intent Call
- 1286.6%Hazardous Condition
- 653.4%Service Call
- 442.3%False Alarm
- Fire incident types reported to NFIRS in Lost Hills, CA
- 27356.3%Outside Fires
- 15030.9%Mobile Property/Vehicle Fires
- 5711.8%Structure Fires
- 51.0%Other
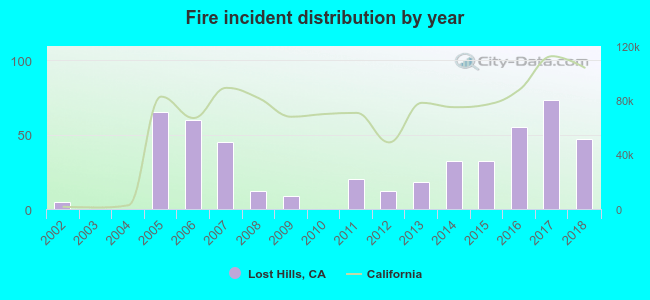 According to the data from the years 2002 - 2018 the average number of fire incidents per year is 29. The highest number of fires - 73 took place in 2017, and the least - 0 in 2003. The data has a growing trend.
 36.5% incidents where reported in the morning and 63.5% in the evening. The most fires (16.9%) took place on Sunday, and the least (11.8%) on Thursday.
 Based on the 485 reports from years 2002 - 2018 most fires (14.0%) took place during July, and the least (4.3%) in February.
 Out of all 1,931 cases reported during the years 2002 - 2018, the most belonged to the categories: Rescue & EMS (49.6%), Fire (25.1%), and Good Intent Call (13.0%).
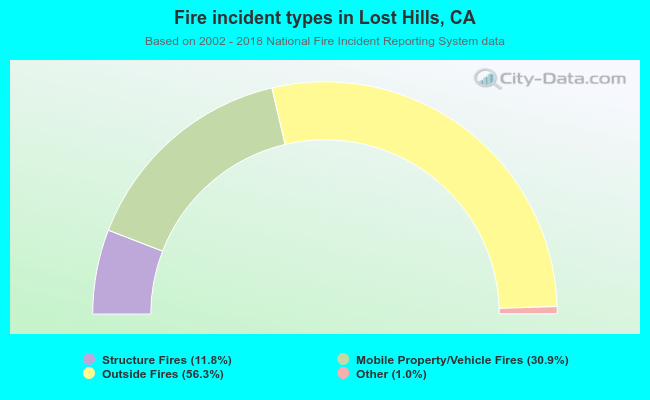 When looking into fire subcategories, the most reports belonged to: Outside Fires (56.3%), and Mobile Property/Vehicle Fires (30.9%).