Maplewood: Fire Incidents, Minnesota (MN)
Where are fire incidents reported in Maplewood, MN
Something went wrong! Please refresh the page.
| Fire incidents reported | |
|---|---|
| Sreet name | Count |
| WHITE BEAR AVE | 170 |
| LARPENTEUR AVE | 88 |
| HUDSON RD | 80 |
| BEAM AVE | 72 |
| HUDSON | 72 |
| COUNTY ROAD D | 70 |
| CENTURY AVE | 66 |
| FROST AVE | 66 |
| HIGHWAY 36 | 54 |
| COUNTY ROAD B | 52 |
| MCKNIGHT RD | 50 |
| LARPENTEUR | 44 |
| UPPER AFTON RD | 40 |
| COUNTY ROAD C | 38 |
| ENGLISH ST | 38 |
| HAZELWOOD ST | 36 |
| HIGHWAY 61 | 34 |
| HUDSON ROAD | 32 |
| STERLING ST | 32 |
| EDGERTON ST | 28 |
| I 94 | 28 |
| BEEBE RD | 26 |
| ROSELAWN AVE | 26 |
| WHITE BEAR | 26 |
| DESOTO ST | 24 |
| EAST SHORE DR | 24 |
| RICE ST | 24 |
| SKILLMAN AVE | 24 |
| COPE AVE | 22 |
| STILLWATER AVE | 22 |
| Other | 118 |
2002 - 2018 National Fire Incident Reporting System (NFIRS) incidents
- Incident types reported to NFIRS in Maplewood, MN
- 18,55078.6%Rescue & EMS
- 1,5266.5%Fire
- 1,0564.5%Good Intent Call
- 1,0444.4%Hazardous Condition
- 9604.1%False Alarm
- 4461.9%Service Call
- Fire incident types reported to NFIRS in Maplewood, MN
- 67544.2%Structure Fires
- 45229.6%Outside Fires
- 27017.7%Mobile Property/Vehicle Fires
- 1298.5%Other
 According to the data from the years 2002 - 2018 the average number of fire incidents per year is 90. The highest number of fire incidents - 135 took place in 2016, and the least - 9 in 2012. The data has an increasing trend.
The average number of yearly fire incidents per 10k residents in Maplewood, MN compared to nearest cities:
(Note: Based on data for the last 3 years, including only cities with population 5,000 and above)
| Maplewood: | 31.1 |
| Oakdale: | 18.4 |
| Little Canada: | 43.0 |
| Vadnais Heights: | 27.4 |
| White Bear Lake: | 19.1 |
| Lake Elmo: | 38.5 |
| Mahtomedi: | 12.8 |
| Roseville: | 26.0 |
| Woodbury: | 7.7 |
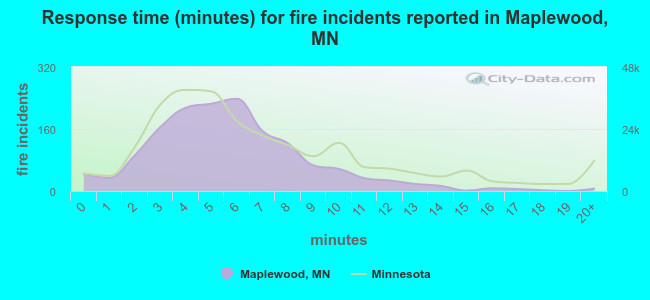 The median response time based on all reported fire incidents is 5 minutes. This is lower compared to the state median value.
The median response time in Maplewood, MN compared to nearest cities:
(Note: Based on data for all years, including only cities with at least 500 fire incidents)
| Maplewood: | 5 minutes |
| Oakdale: | 5 minutes |
| Little Canada: | 3 minutes |
| Vadnais Heights: | 6 minutes |
| White Bear Lake: | 6 minutes |
| Lake Elmo: | 7 minutes |
| Roseville: | 5 minutes |
| Woodbury: | 6 minutes |
| South St. Paul: | 3 minutes |
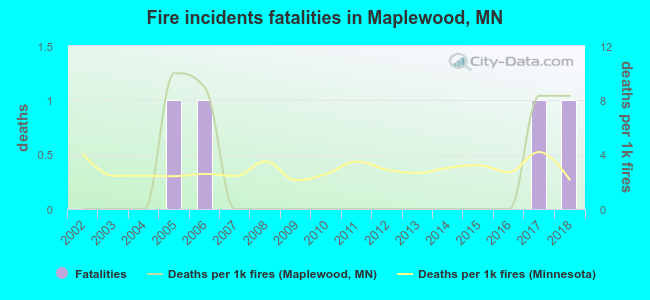 Based on the data from the years 2002 - 2018 the average number of fire-related fatalities per year is 0. The highest number of deaths - 1 took place in 2005, and the lowest - 0 in 2002. The data has an increasing trend.
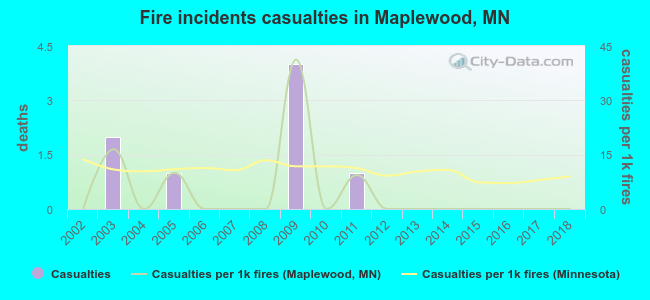 According to the reports from the years 2002 - 2018 the average number of fire-related yearly casualties is 0. The highest number of casualties - 4 took place in 2009, and the lowest - 0 in 2002. The data has a constant trend.
The average number of casualties per 1,000 fires is 5. This indicator was the highest - 41 in 2009, and the lowest 0 in 2002. The trend for injuries per 1,000 fire incidents is constant. Compared to the state value the number of casualties per 1,000 incidents is much lower.
According to the reports from the years 2002 - 2018 the average number of fire-related yearly casualties is 0. The highest number of casualties - 4 took place in 2009, and the lowest - 0 in 2002. The data has a constant trend.
The average number of casualties per 1,000 fires is 5. This indicator was the highest - 41 in 2009, and the lowest 0 in 2002. The trend for injuries per 1,000 fire incidents is constant. Compared to the state value the number of casualties per 1,000 incidents is much lower.Casualties per 1,000 incidents in Maplewood, MN compared to nearest cities:
(Note: Based on data for all years, including only cities with at least 500 fire incidents)
| Maplewood: | 5.2 |
| Oakdale: | 11.8 |
| Little Canada: | 2.6 |
| Vadnais Heights: | 5.9 |
| White Bear Lake: | 20.0 |
| Lake Elmo: | 7.0 |
| Roseville: | 15.3 |
| Woodbury: | 12.2 |
| South St. Paul: | 3.8 |
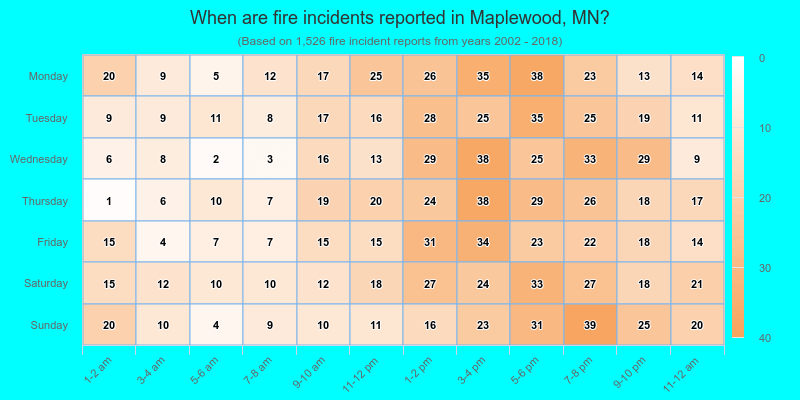
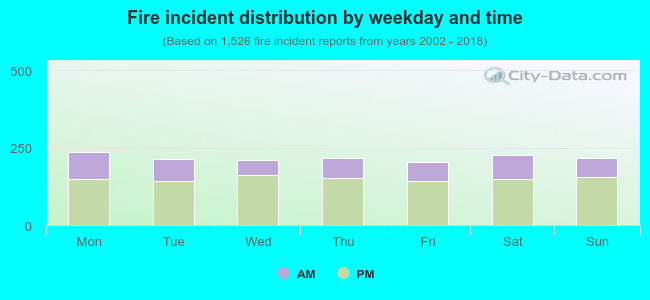 31.0% incidents where reported in the morning and 69.0% in the evening. The most fires (15.5%) took place on Monday, and the least (13.4%) on Friday.
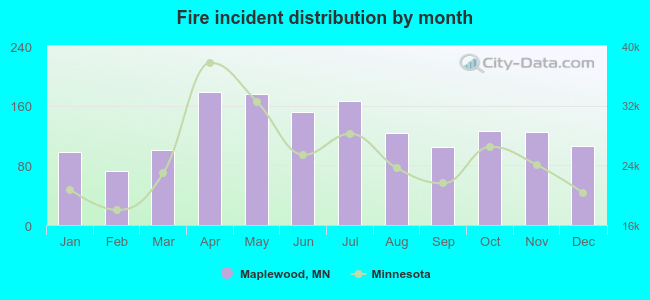 Based on the 1,526 fire incidents from years 2002 - 2018 most fires (11.7%) took place during April, and the least (4.7%) in February.
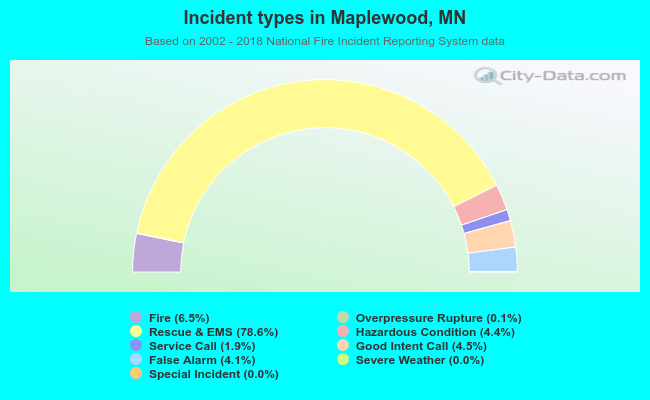 Out of all 23,613 cases reported during the years 2002 - 2018, the most belonged to the categories: Rescue & EMS (78.6%), Fire (6.5%), and Good Intent Call (4.5%).
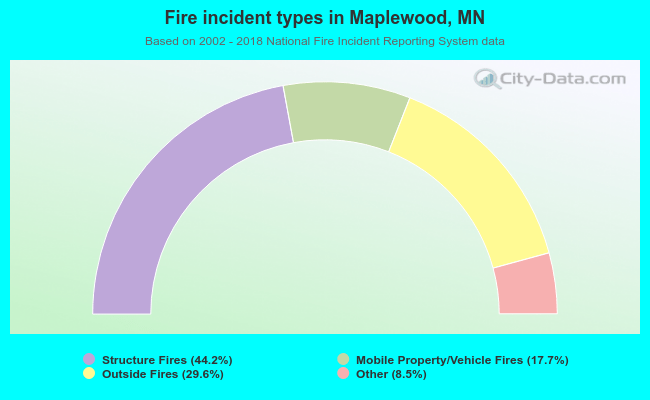 When looking into fire subcategories, the most incidents belonged to: Structure Fires (44.2%), and Outside Fires (29.6%).