| Fire incidents reported |
|---|
| Sreet name | Count |
|---|
| 975 COUNTY ROAD 507 | 15 | | CR 57 | 15 | | OCTOBER DRIVE | 13 | | 1 COUNTY ROAD 508 | 10 | | 2166 CR 123 | 10 | | 2609 COUNTY ROAD 503 | 10 | | 486 COUNTY ROAD 507 | 10 | | CR 32 | 10 | | HIGHWAY 31 | 10 | | I 65 FWY | 10 | | 2891 HWY 31 N | 8 | | CO RD 150 | 8 | | CO RD 20 | 8 | | CO RD 49 | 8 | | COUNTY 68 RD | 8 | | COUNTY ROAD 20 | 8 | | COUNTY ROAD 68 | 8 | | NEW HARMONY RD | 8 | | 1055 COUNTY ROAD 446 | 5 | | 1060 COUNTY ROAD 508 | 5 | | 1109 COUNTY ROAD 446 | 5 | | 1130 COUNTY ROAD 446 | 5 | | 116 COUNTY ROAD 506 | 5 | | 1241 COUNTY ROAD 63 | 5 | | 1300 CR 446 | 5 |
| | | Fire incidents reported |
|---|
| Sreet name | Count |
|---|
| 1360 CO RD 446 | 5 | | 1370 COUNTY ROAD 446 | 5 | | 1370 CR 446 LGTS | 5 | | 1385 COUNTY ROAD 507 | 5 | | 1396 COUNTY ROAD 507 | 5 | | 169 COUNTY ROAD 20 W | 5 | | 195 COUNTY ROAD 508 | 5 | | 2113 CR 65 | 5 | | 2147 CR 123 | 5 | | 2223 CR 123 | 5 | | 2377 CR 65 | 5 | | 239 COUNTY ROAD 755 | 5 | | 246 CR 68 | 5 | | 2551 COUNTY ROAD 57 | 5 | | 261 COUNTY ROAD 531 | 5 | | 2791 CR 59 LGTS | 5 | | 2847 CR 99 LGTS | 5 | | 2962 MARBURY HTS RD | 5 | | 3058 CR 143 | 5 | | 3058 HWY 43 | 5 | | 3105 CR 57 | 5 | | 3129 CR 57 | 5 | | 365 HIGHWAY 143 | 5 | | 366 COUNTY ROAD 446 | 5 | | 42 COUNTY ROAD 446 | 5 |
|
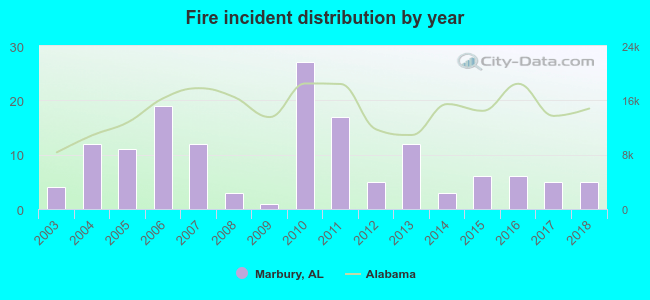 According to the data from the years 2003 - 2018 the average number of fire incidents per year is 9. The highest number of reported fire incidents - 27 took place in 2010, and the least - 1 in 2009. The data has an increasing trend.
 31.1% incidents where reported in the morning and 68.9% in the evening. The most fires (15.5%) took place on Saturday, and the least (12.2%) on Wednesday.
 Based on the 148 reports from years 2003 - 2018 most fires (16.2%) took place during February, and the least (4.1%) in April.
 Out of all 167 cases reported during the years 2003 - 2018, the most belonged to the categories: Fire (88.6%), Service Call (6.0%), and Overpressure Rupture (1.8%).
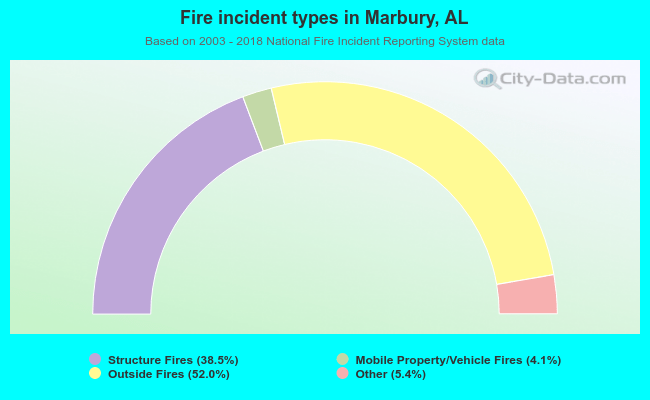 When looking into fire subcategories, the most reports belonged to: Outside Fires (52.0%), and Structure Fires (38.5%).