Markle: Fire Incidents, Indiana (IN)
Where are fire incidents reported in Markle, IN
Something went wrong! Please refresh the page.
|
| |||||||||||||||||||||||||||||||||||||||||||||||||||||||||||||||||||||||||||||||||||||||||||||||||||||||||||||
2002 - 2018 National Fire Incident Reporting System (NFIRS) incidents
- Incident types reported to NFIRS in Markle, IN
- 60347.4%Rescue & EMS
- 31424.7%Fire
- 20416.0%Hazardous Condition
- 1007.9%Good Intent Call
- 231.8%Service Call
- 201.6%False Alarm
- 50.4%Special Incident
- 20.2%Overpressure Rupture
- 20.2%Severe Weather
- Fire incident types reported to NFIRS in Markle, IN
- 11436.3%Structure Fires
- 9831.2%Outside Fires
- 9028.7%Mobile Property/Vehicle Fires
- 123.8%Other
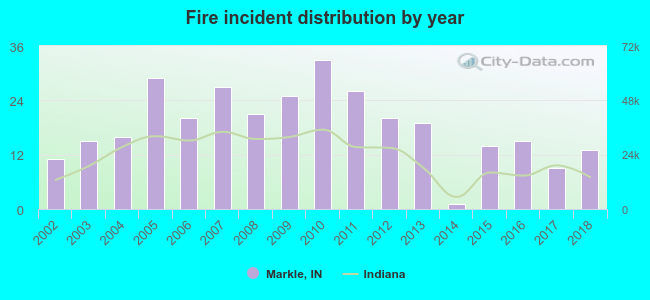 According to the data from the years 2002 - 2018 the average number of fire incidents per year is 18. The highest number of reported fire incidents - 33 took place in 2010, and the least - 1 in 2014. The data has a growing trend.
 29.9% incidents where reported in the morning and 70.1% in the evening. The most fires (16.9%) took place on Wednesday, and the least (12.7%) on Monday.
 According to the 314 incident reports from years 2002 - 2018 most fires (14.0%) took place during April, and the least (5.4%) in August.
 Out of all 1,273 cases reported during the years 2002 - 2018, the most belonged to the categories: Rescue & EMS (47.4%), Fire (24.7%), and Hazardous Condition (16.0%).
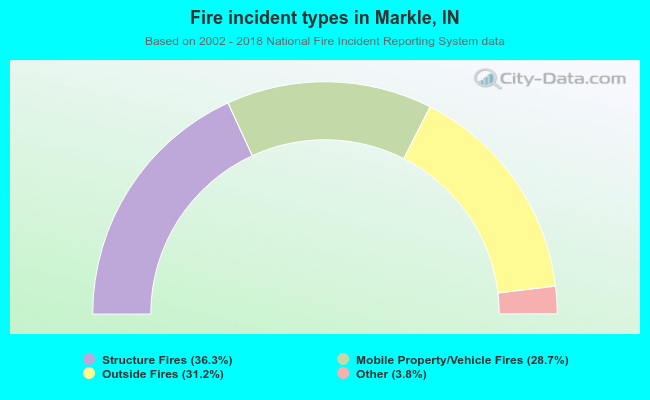 When looking into fire subcategories, the most incidents belonged to: Structure Fires (36.3%), and Outside Fires (31.2%).