Mason: Fire Incidents, Ohio (OH)
Where are fire incidents reported in Mason, OH
Something went wrong! Please refresh the page.
| Fire incidents reported | |
|---|---|
| Sreet name | Count |
| MASON-MONTGOMERY RD | 426 |
| READING RD | 142 |
| TYLERSVILLE RD | 118 |
| SNIDER RD | 100 |
| MASONMONTGOMERY RD | 82 |
| CEDAR VILLAGE DR | 80 |
| WESTERN ROW RD | 80 |
| BETHANY RD | 64 |
| KINGS ISLAND DR | 64 |
| MAIN ST | 60 |
| ST RT 741 | 60 |
| KINGS MILLS RD | 48 |
| CIRCLE DR | 40 |
| WESTERN ROW | 40 |
| FAIRWAY DR | 38 |
| INNOVATION WAY | 38 |
| I 71 | 36 |
| SNIDER CT | 36 |
| ST RT | 34 |
| FOUNTAIN CIRCLE DR | 32 |
| CINTAS BLVD | 30 |
| COURSEVIEW DR | 30 |
| MAXWELL DR | 28 |
| BROOKCREST DR | 26 |
| GREAT WOLF DR | 26 |
| I71 NB | 26 |
| TRADEWIND DR | 26 |
| US RT | 26 |
| US RT 42 | 26 |
| WATERPARK DR | 26 |
| Other | 138 |
2002 - 2018 National Fire Incident Reporting System (NFIRS) incidents
- Incident types reported to NFIRS in Mason, OH
- 13,96158.3%Rescue & EMS
- 2,2429.4%Hazardous Condition
- 2,0268.5%Fire
- 1,8427.7%False Alarm
- 1,6516.9%Good Intent Call
- 1,4276.0%Special Incident
- 6972.9%Service Call
- 730.3%Severe Weather
- Fire incident types reported to NFIRS in Mason, OH
- 97748.2%Structure Fires
- 86142.5%Outside Fires
- 1808.9%Mobile Property/Vehicle Fires
- 80.4%Other
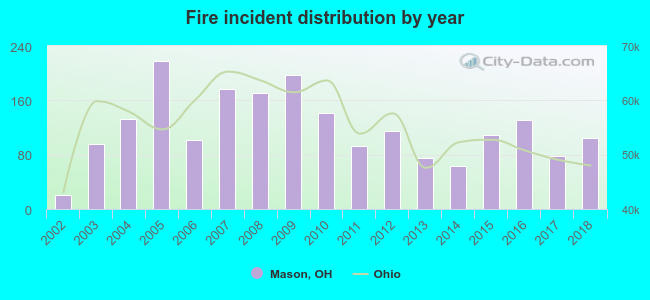 Based on the data from the years 2002 - 2018 the average number of fires per year is 119. The highest number of reported fire incidents - 218 took place in 2005, and the least - 21 in 2002. The data has an increasing trend.
The average number of yearly fire incidents per 10k residents in Mason, OH compared to nearest cities:
(Note: Based on data for the last 3 years, including only cities with population 5,000 and above)
| Mason: | 33.1 |
| Loveland: | 55.1 |
| Monroe: | 33.4 |
| Sharonville: | 65.8 |
| Lebanon: | 29.0 |
| Montgomery: | 22.3 |
| Blue Ash: | 53.8 |
| Springdale: | 78.8 |
| Middletown: | 44.0 |
 The median response time based on all reported fire incidents is 5 minutes. This is lower compared to the Ohio median value.
The median response time in Mason, OH compared to nearest cities:
(Note: Based on data for all years, including only cities with at least 500 fire incidents)
| Mason: | 5 minutes |
| Loveland: | 5 minutes |
| Monroe: | 5 minutes |
| Sharonville: | 6 minutes |
| Montgomery: | 6 minutes |
| Blue Ash: | 5 minutes |
| Evendale: | 5 minutes |
| Springdale: | 5 minutes |
| Middletown: | 5 minutes |
 According to the reports from the years 2002 - 2018 the average number of fire-related fatalities per year is 0. The highest number of reported deaths - 5 took place in 2008, and the lowest - 0 in 2002. The data has a constant trend.
 According to the reports from the years 2002 - 2018 the average number of fire-related yearly casualties is 1. The highest number of reported injuries - 2 took place in 2008, and the lowest - 0 in 2002. The data has a constant trend.
The average number of casualties per 1,000 fires is 6. This indicator was the highest - 27 in 2013, and the lowest 0 in 2002. The trend for injuries per 1,000 incidents is constant. Compared to the Ohio value the number of injuries per 1,000 incidents is much lower.
According to the reports from the years 2002 - 2018 the average number of fire-related yearly casualties is 1. The highest number of reported injuries - 2 took place in 2008, and the lowest - 0 in 2002. The data has a constant trend.
The average number of casualties per 1,000 fires is 6. This indicator was the highest - 27 in 2013, and the lowest 0 in 2002. The trend for injuries per 1,000 incidents is constant. Compared to the Ohio value the number of injuries per 1,000 incidents is much lower.Casualties per 1,000 incidents in Mason, OH compared to nearest cities:
(Note: Based on data for all years, including only cities with at least 500 fire incidents)
| Mason: | 5.4 |
| Loveland: | 50.7 |
| Monroe: | 20.9 |
| Sharonville: | 6.8 |
| Montgomery: | 4.6 |
| Blue Ash: | 25.6 |
| Evendale: | 3.7 |
| Springdale: | 21.1 |
| Middletown: | 30.9 |
 27.7% incidents where reported in the morning and 72.3% in the evening. The most fires (16.3%) took place on Tuesday, and the least (11.7%) on Saturday.
 According to the 2,026 fire incident reports from years 2002 - 2018 most fires (16.1%) took place during April, and the least (4.9%) in December.
 Out of all 23,937 cases reported during the years 2002 - 2018, the most belonged to the categories: Rescue & EMS (58.3%), Hazardous Condition (9.4%), and Fire (8.5%).
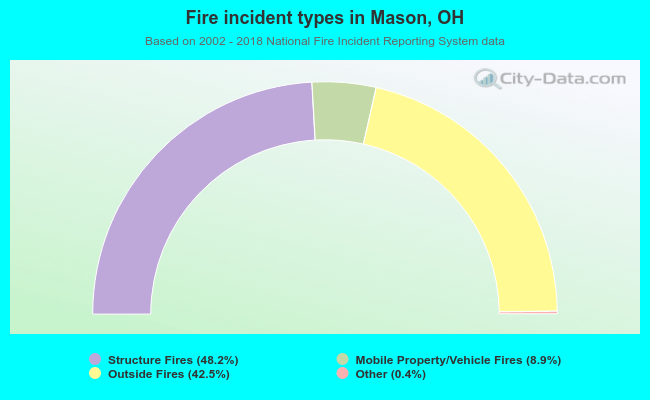 When looking into fire subcategories, the most incidents belonged to: Structure Fires (48.2%), and Outside Fires (42.5%).