Matthews: Fire Incidents, North Carolina (NC)
Where are fire incidents reported in Matthews, NC
Something went wrong! Please refresh the page.
| Fire incidents reported | |
|---|---|
| Sreet name | Count |
| INDEPENDENCE BLVD | 172 |
| MATTHEWS TOWNSHIP PKY | 84 |
| JOHN ST | 66 |
| SAM NEWELL RD | 62 |
| IDLEWILD RD | 46 |
| I485 | 40 |
| MONROE RD | 40 |
| CAMPUS RIDGE RD | 38 |
| PLANTATION ESTATES DR | 38 |
| TRADE ST | 34 |
| MATTHEWS-MINT HILL RD | 30 |
| POTTER RD | 30 |
| PLEASANT PLAINS RD | 28 |
| PACES AVE | 24 |
| GANDER COVE LN | 22 |
| MATTHEWS ST | 22 |
| WINDSOR HILL DR | 22 |
| WINDSOR SQUARE DR | 22 |
| MATTHEWSMINT HILL RD | 20 |
| MORNINGWOOD DR | 20 |
| NORTHEAST PKY | 20 |
| WEDDINGTON RD | 20 |
| CRESCENT LN | 18 |
| STEVENS MILL RD | 18 |
| STALLINGS RD | 16 |
| PHILLIPS RD | 14 |
| SELMA BURKE LN | 14 |
| CHAMBERS DR | 12 |
| CPCC LN | 12 |
| CREWS RD | 12 |
| Other | 317 |
2002 - 2018 National Fire Incident Reporting System (NFIRS) incidents
- Incident types reported to NFIRS in Matthews, NC
- 5,97044.5%Rescue & EMS
- 2,49118.6%Good Intent Call
- 1,3339.9%Fire
- 1,3239.9%Hazardous Condition
- 1,3089.8%False Alarm
- 9296.9%Service Call
- 240.2%Severe Weather
- 200.1%Special Incident
- Fire incident types reported to NFIRS in Matthews, NC
- 59244.4%Structure Fires
- 51438.6%Outside Fires
- 18013.5%Mobile Property/Vehicle Fires
- 473.5%Other
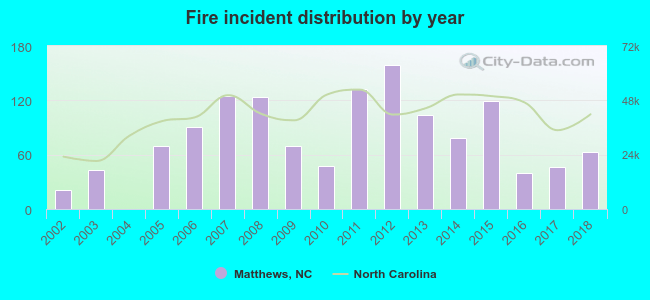 According to the data from the years 2002 - 2018 the average number of fire incidents per year is 78. The highest number of reported fire incidents - 159 took place in 2012, and the least - 0 in 2004. The data has a rising trend.
The average number of yearly fire incidents per 10k residents in Matthews, NC compared to nearest cities:
(Note: Based on data for the last 3 years, including only cities with population 5,000 and above)
| Matthews: | 16.6 |
| Stallings: | 19.4 |
| Indian Trail: | 24.3 |
| Mint Hill: | 26.7 |
| Weddington: | 13.6 |
| Wesley Chapel: | 13.4 |
| Charlotte: | 21.2 |
| Pineville: | 44.1 |
| Marvin: | 8.8 |
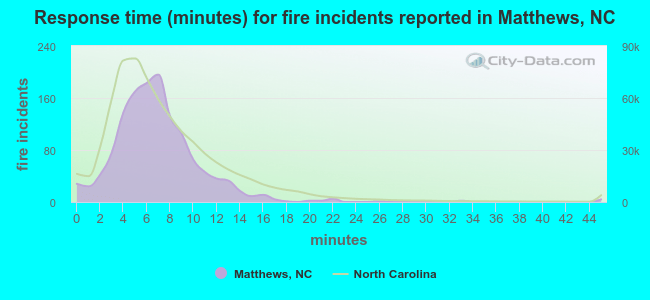 The median response time based on all reported fire incidents is 7 minutes. This is close to the state median value.
The median response time in Matthews, NC compared to nearest cities:
(Note: Based on data for all years, including only cities with at least 500 fire incidents)
| Matthews: | 7 minutes |
| Indian Trail: | 7 minutes |
| Mint Hill: | 7 minutes |
| Charlotte: | 5 minutes |
| Pineville: | 7 minutes |
| Monroe: | 6 minutes |
| Waxhaw: | 8 minutes |
| Belmont: | 7 minutes |
| Concord: | 5 minutes |
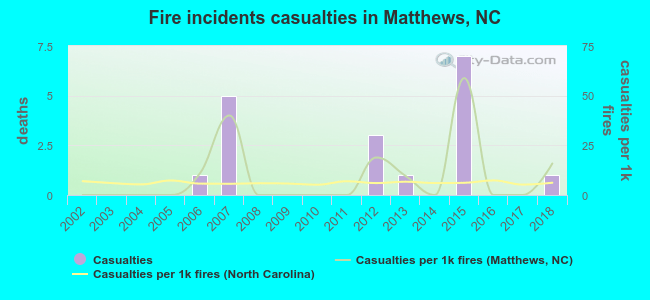 Based on the reports from the years 2002 - 2018 the average number of fire-related casualties per year is 1. The highest number of casualties - 7 took place in 2015, and the lowest - 0 in 2002. The data has a growing trend.
The average number of injuries per 1,000 fires is 9. This indicator was the highest - 59 in 2015, and the lowest 0 in 2002. The trend for injuries per 1,000 fires is growing. Compared to the North Carolina value the number of injuries per 1,000 fire incidents is much higher.
Based on the reports from the years 2002 - 2018 the average number of fire-related casualties per year is 1. The highest number of casualties - 7 took place in 2015, and the lowest - 0 in 2002. The data has a growing trend.
The average number of injuries per 1,000 fires is 9. This indicator was the highest - 59 in 2015, and the lowest 0 in 2002. The trend for injuries per 1,000 fires is growing. Compared to the North Carolina value the number of injuries per 1,000 fire incidents is much higher.
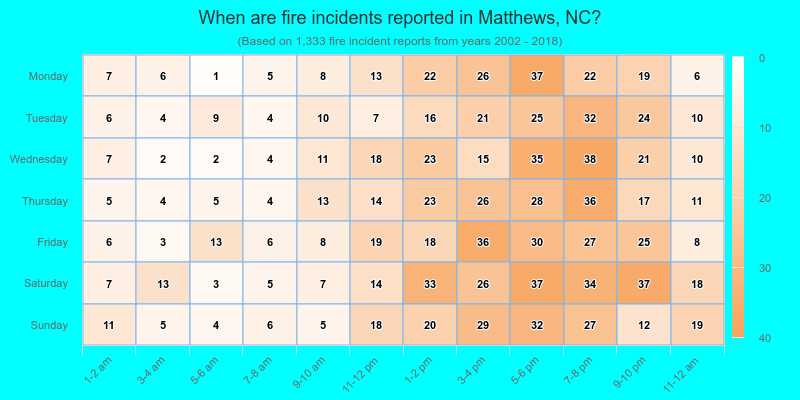
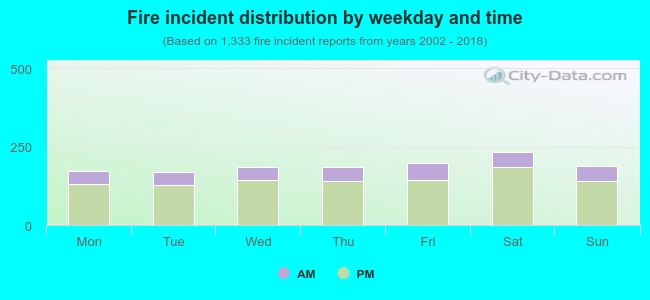 24.2% incidents where reported in the morning and 75.8% in the evening. The most fires (17.6%) took place on Saturday, and the least (12.6%) on Tuesday.
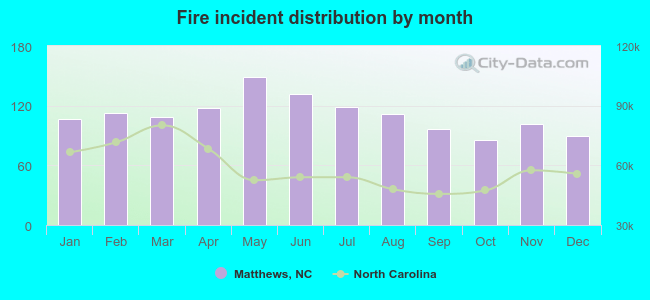 According to the 1,333 reports from years 2002 - 2018 most fires (11.2%) took place during May, and the least (6.4%) in October.
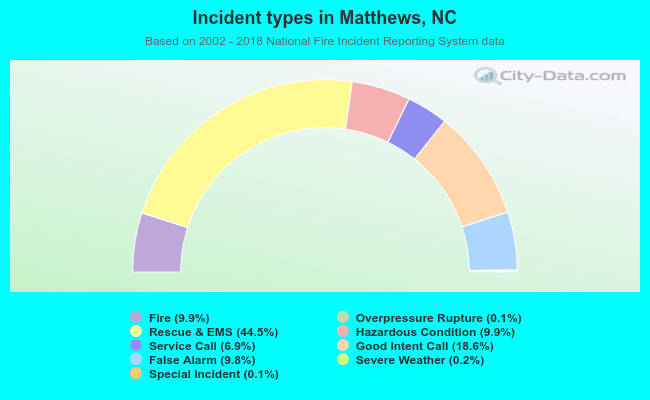 Out of all 13,408 cases reported during the years 2002 - 2018, the most belonged to the categories: Rescue & EMS (44.5%), Good Intent Call (18.6%), and Fire (9.9%).
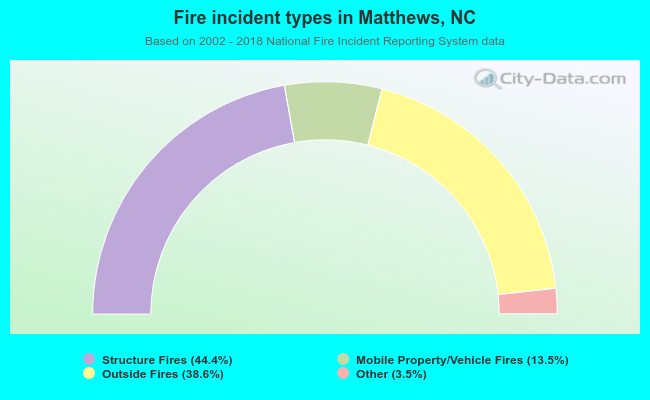 When looking into fire subcategories, the most incidents belonged to: Structure Fires (44.4%), and Outside Fires (38.6%).