Miami Gardens: Fire Incidents, Florida (FL)
Where are fire incidents reported in Miami Gardens, FL
Something went wrong! Please refresh the page.
| Fire incidents reported | |
|---|---|
| Sreet name | Count |
| 27TH AVE | 90 |
| 183RD ST | 84 |
| 7TH AVE | 64 |
| NW 199TH ST&NW 2ND AVE | 64 |
| 2ND AVE | 60 |
| 17TH AVE | 54 |
| 199TH ST | 54 |
| 2 AVE | 52 |
| 27 AVE | 44 |
| 177TH ST | 40 |
| 167TH ST | 38 |
| 179TH ST | 36 |
| 207TH ST | 36 |
| 183 ST | 34 |
| 199 ST | 30 |
| 22 AVE | 30 |
| 22ND AVE | 30 |
| 7 AVE | 30 |
| 37TH AVE | 26 |
| NW 199TH STNW 27TH AVE | 26 |
| NW 199TH STTPK EXPY | 26 |
| 195TH ST | 24 |
| 214 ST | 24 |
| 14TH PL | 22 |
| 185 ST | 22 |
| 210TH ST | 22 |
| 200TH ST | 20 |
| 28TH CT | 20 |
| NW 183RD STNW 2ND AVE | 20 |
| 170TH ST | 18 |
| Other | 1,585 |
2008 - 2018 National Fire Incident Reporting System (NFIRS) incidents
- Incident types reported to NFIRS in Miami Gardens, FL
- 58,69080.6%Rescue & EMS
- 3,6515.0%Good Intent Call
- 3,3064.5%False Alarm
- 2,7253.7%Fire
- 2,4423.4%Service Call
- 1,9412.7%Hazardous Condition
- Fire incident types reported to NFIRS in Miami Gardens, FL
- 96235.3%Structure Fires
- 85231.3%Mobile Property/Vehicle Fires
- 84631.0%Outside Fires
- 652.4%Other
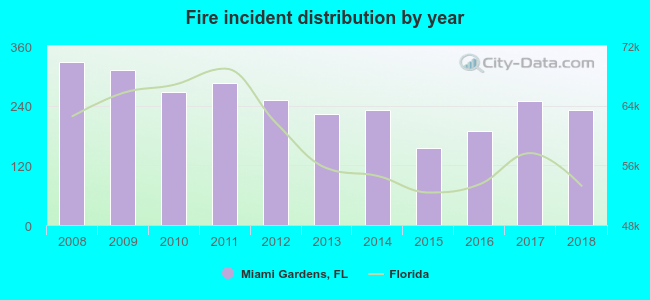 According to the data from the years 2008 - 2018 the average number of fire incidents per year is 248. The highest number of reported fire incidents - 327 took place in 2008, and the least - 155 in 2015. The data has a decreasing trend.
 The median response time based on all reported fire incidents is 6 minutes. This is close to the state median value.
The median response time in Miami Gardens, FL compared to nearest cities:
(Note: Based on data for all years, including only cities with at least 500 fire incidents)
| Miami Gardens: | 6 minutes |
| West Park: | 5 minutes |
| Hollywood: | 6 minutes |
| Hallandale: | 5 minutes |
| North Miami Beach: | 6 minutes |
| Miramar: | 6 minutes |
| North Miami: | 6 minutes |
| Cooper City: | 6 minutes |
| Pembroke Pines: | 5 minutes |
 36.0% incidents where reported in the morning and 64.0% in the evening. The most fires (16.6%) took place on Saturday, and the least (12.2%) on Thursday.
 According to the 2,725 fires from years 2008 - 2018 most fires (10.5%) took place during May, and the least (6.7%) in November.
 Out of all 72,773 cases reported during the years 2008 - 2018, the most belonged to the categories: Rescue & EMS (80.6%), Good Intent Call (5.0%), and False Alarm (4.5%).
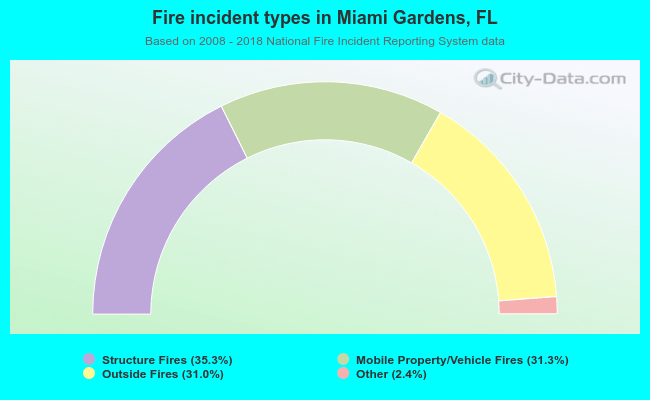 When looking into fire subcategories, the most incidents belonged to: Structure Fires (35.3%), and Mobile Property/Vehicle Fires (31.3%).