Miamisburg: Fire Incidents, Ohio (OH)
Where are fire incidents reported in Miamisburg, OH
Something went wrong! Please refresh the page.
| Fire incidents reported | |
|---|---|
| Sreet name | Count |
| BYERS RD | 168 |
| I-75 FWY | 130 |
| CENTRAL AVE | 120 |
| SPRINGBORO**** PIKE | 104 |
| MAIN ST | 100 |
| SPRINGBORO PIKE | 96 |
| HEINCKE RD | 78 |
| LYONS GATE WAY | 66 |
| RIVERVIEW AVE | 64 |
| PEARL ST | 62 |
| LINDEN AVE | 54 |
| PRESTIGE PL | 50 |
| CHAUTAUQUA RD | 46 |
| SYCAMORE ST | 44 |
| TOWSON BLVD | 44 |
| UPPER MIAMISBURG RD | 44 |
| 75 | 42 |
| ORCHARD HILL DR | 40 |
| TAOS DR | 34 |
| BELVO RD | 32 |
| MIAMISBURG CENTERVILLE RD | 32 |
| UNION RD | 32 |
| FIRST ST | 30 |
| I75SB | 30 |
| SECOND ST | 30 |
| SEIBERT AVE | 30 |
| BENNER RD | 28 |
| CROSS VILLAGE DR | 28 |
| ELEVENTH ST | 28 |
| KERCHER ST | 28 |
| Other | 527 |
2002 - 2018 National Fire Incident Reporting System (NFIRS) incidents
- Incident types reported to NFIRS in Miamisburg, OH
- 17,46762.6%Rescue & EMS
- 2,4698.8%Service Call
- 2,4418.7%Hazardous Condition
- 2,2418.0%Fire
- 1,6686.0%Good Intent Call
- 1,3965.0%False Alarm
- 1200.4%Special Incident
- 690.2%Severe Weather
- 340.1%Overpressure Rupture
- Fire incident types reported to NFIRS in Miamisburg, OH
- 1,00644.9%Structure Fires
- 78935.2%Outside Fires
- 43519.4%Mobile Property/Vehicle Fires
- 110.5%Other
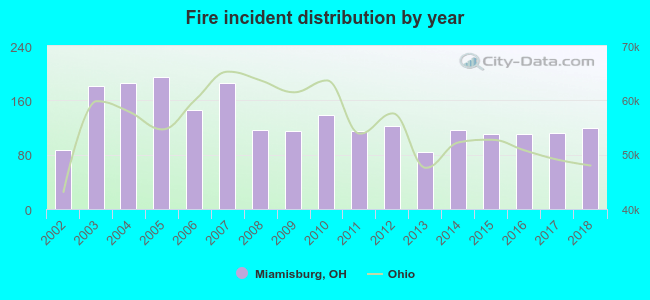 Based on the data from the years 2002 - 2018 the average number of fires per year is 132. The highest number of fire incidents - 195 took place in 2005, and the least - 84 in 2013. The data has a growing trend.
The average number of yearly fire incidents per 10k residents in Miamisburg, OH compared to nearest cities:
(Note: Based on data for the last 3 years, including only cities with population 5,000 and above)
| Miamisburg: | 56.7 |
| West Carrollton City: | 1.2 |
| West Carrollton: | 35.8 |
| Carlisle: | 41.7 |
| Moraine: | 108.9 |
| Germantown: | 65.4 |
| Franklin: | 54.2 |
| Springboro: | 20.9 |
| Centerville: | 14.6 |
 The median response time based on all reported fire incidents is 6 minutes. This is similar to the state median value.
The median response time in Miamisburg, OH compared to nearest cities:
(Note: Based on data for all years, including only cities with at least 500 fire incidents)
| Miamisburg: | 6 minutes |
| West Carrollton: | 5 minutes |
| Carlisle: | 6 minutes |
| Moraine: | 5 minutes |
| Germantown: | 7 minutes |
| Franklin: | 5 minutes |
| Springboro: | 6 minutes |
| Centerville: | 7 minutes |
| Kettering: | 6 minutes |
 According to the data from the years 2002 - 2018 the average number of fire-related yearly deaths is 0. The highest number of deaths - 2 took place in 2003, and the lowest - 0 in 2002. The data has a constant trend.
 According to the reports from the years 2002 - 2018 the average number of fire-related yearly casualties is 2. The highest number of reported casualties - 5 took place in 2009, and the lowest - 0 in 2002. The data has an increasing trend.
The average number of injuries per 1,000 fires is 14. This indicator was the highest - 43 in 2009, and the lowest 0 in 2002. The trend for casualties per 1,000 fires is growing. Compared to the Ohio value the number of injuries per 1,000 fire incidents is similar.
According to the reports from the years 2002 - 2018 the average number of fire-related yearly casualties is 2. The highest number of reported casualties - 5 took place in 2009, and the lowest - 0 in 2002. The data has an increasing trend.
The average number of injuries per 1,000 fires is 14. This indicator was the highest - 43 in 2009, and the lowest 0 in 2002. The trend for casualties per 1,000 fires is growing. Compared to the Ohio value the number of injuries per 1,000 fire incidents is similar.Casualties per 1,000 incidents in Miamisburg, OH compared to nearest cities:
(Note: Based on data for all years, including only cities with at least 500 fire incidents)
| Miamisburg: | 14.3 |
| West Carrollton: | 23.9 |
| Carlisle: | 31.9 |
| Moraine: | 20.1 |
| Germantown: | 28.0 |
| Franklin: | 21.5 |
| Springboro: | 11.8 |
| Centerville: | 33.9 |
| Kettering: | 25.7 |
 30.6% incidents where reported in the morning and 69.4% in the evening. The most fires (16.1%) took place on Saturday, and the least (13.0%) on Thursday.
 Based on the 2,241 fire incidents from years 2002 - 2018 most fires (10.4%) took place during April, and the least (5.4%) in February.
 Out of all 27,905 cases reported during the years 2002 - 2018, the most belonged to the categories: Rescue & EMS (62.6%), Service Call (8.8%), and Hazardous Condition (8.7%).
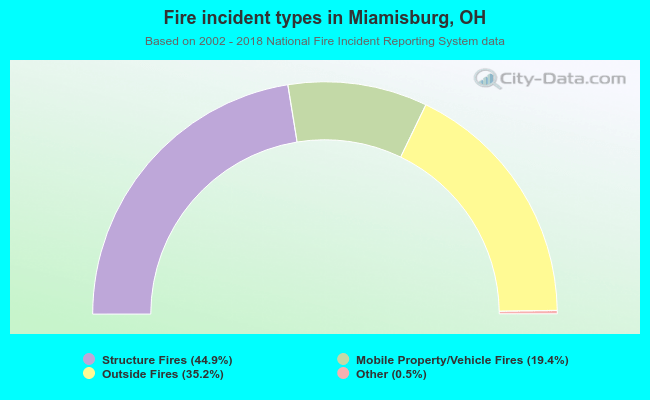 When looking into fire subcategories, the most incidents belonged to: Structure Fires (44.9%), and Outside Fires (35.2%).