Michigantown: Fire Incidents, Indiana (IN)
Where are fire incidents reported in Michigantown, IN
Something went wrong! Please refresh the page.
|
| |||||||||||||||||||||||||||||||||||||||||||||||||||||||||||||
| Other | 32 | |||||||||||||||||||||||||||||||||||||||||||||||||||||||||||||
2002 - 2018 National Fire Incident Reporting System (NFIRS) incidents
- Incident types reported to NFIRS in Michigantown, IN
- 16444.6%Rescue & EMS
- 12032.6%Fire
- 4211.4%Good Intent Call
- 277.3%Hazardous Condition
- 82.2%Service Call
- 51.4%False Alarm
- 10.3%Severe Weather
- 10.3%Special Incident
- Fire incident types reported to NFIRS in Michigantown, IN
- 5243.3%Structure Fires
- 3831.7%Outside Fires
- 1915.8%Mobile Property/Vehicle Fires
- 119.2%Other
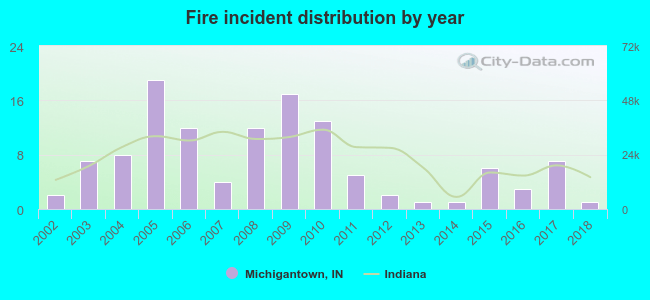 Based on the data from the years 2002 - 2018 the average number of fires per year is 7. The highest number of fire incidents - 19 took place in 2005, and the least - 1 in 2013. The data has a dropping trend.
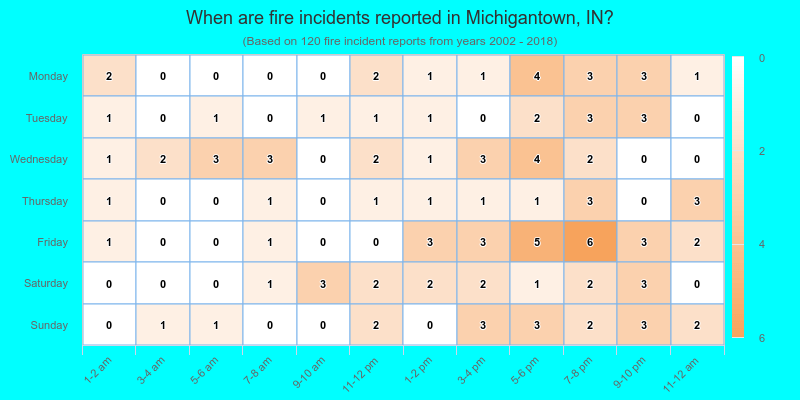
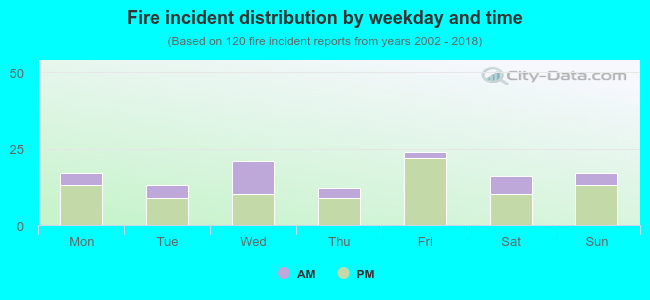 28.3% incidents where reported in the morning and 71.7% in the evening. The most fires (20.0%) took place on Friday, and the least (10.0%) on Thursday.
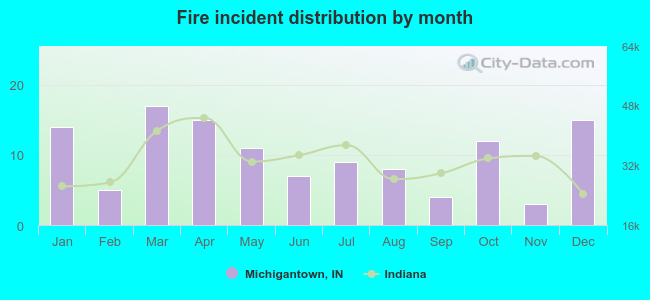 According to the 120 fires from years 2002 - 2018 most fires (14.2%) took place during March, and the least (2.5%) in November.
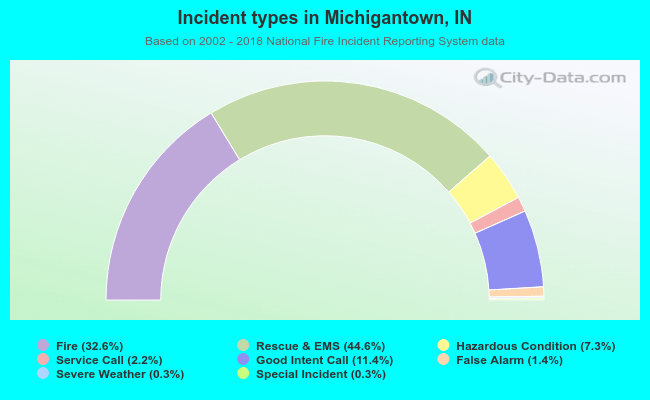 Out of all 368 cases reported during the years 2002 - 2018, the most belonged to the categories: Overpressure Rupture (44.6%), Fire (32.6%), and Service Call (11.4%).
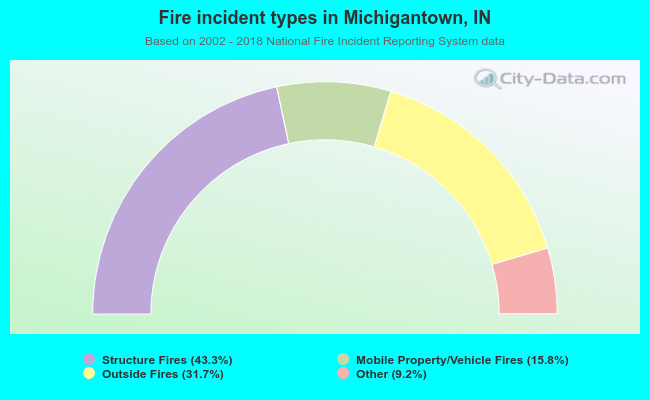 When looking into fire subcategories, the most incidents belonged to: Structure Fires (43.3%), and Outside Fires (31.7%).